Analyzing your project's traceability status: the "Analysis" perspective
Inspecting the traceability status, doing coverage analysis, calculating the impact of change, preparing meaningful management reports: That's what the Analysis perspective is for.
If instead you want create, modify, or delete links, please see the section on ANALYZE Editor.
The Analysis perspective has two major fields of activity:
- The dashboard application gives you an overview of your traceability project and the option to drill down quickly to specific aspects.
- The query application allows you to write and run your own queries, in order to answer customized questions and deliver very specific evaluations pertaining to your individual project and trace model.
The Analysis perspective consists of a couple of views that are, by default, arranged in a particular order and have particular sizes. You can change this arrangement at will, and you can even save your preferred arrangement as a new perspective or override the default settings of the Analysis perspective.
Overview of the "Analysis" perspective
This section gives an overview of the Analysis perspective. You will find more detailed information in subsequent sections.
General project metrics: the dashboard
The dashboard provides answers to typical questions in traceability projects. For answers to not-so-typical questions, please see the section on customized queries.
- Which kinds of trace links do we have and how many of each?
- What are the artifacts we have and how many of each type?
- Which of our artifacts have trace links to other artifacts, in total as well as broken down by artifact type?
- Which of our artifacts do not have trace links to other artifacts, in total as well as broken down by artifact type?
Read an introduction on requirements coverage and what itemis ANALYZE can do for you in this regard in the blog post "What is requirements coverage and how can it be analyzed?".
Figure "The Analysis perspective; using the dashboard" exemplifies how this can look like:
- The ANALYZE Dashboard view (top-left) displays a breakdown of the linked artifacts, including their numbers. Each pie chart section represents a different artifact type.
- Selecting one or more pie chart sections makes them explode and displays their contents (here: artifacts) in the ANALYZE Dashboard Details view (bottom-left).
- Selecting an artifact in ANALYZE Dashboard Details displays its properties in the Properties view (bottom-right) and its relationships to other artifacts in the ANALYZE Overview view (top-right).
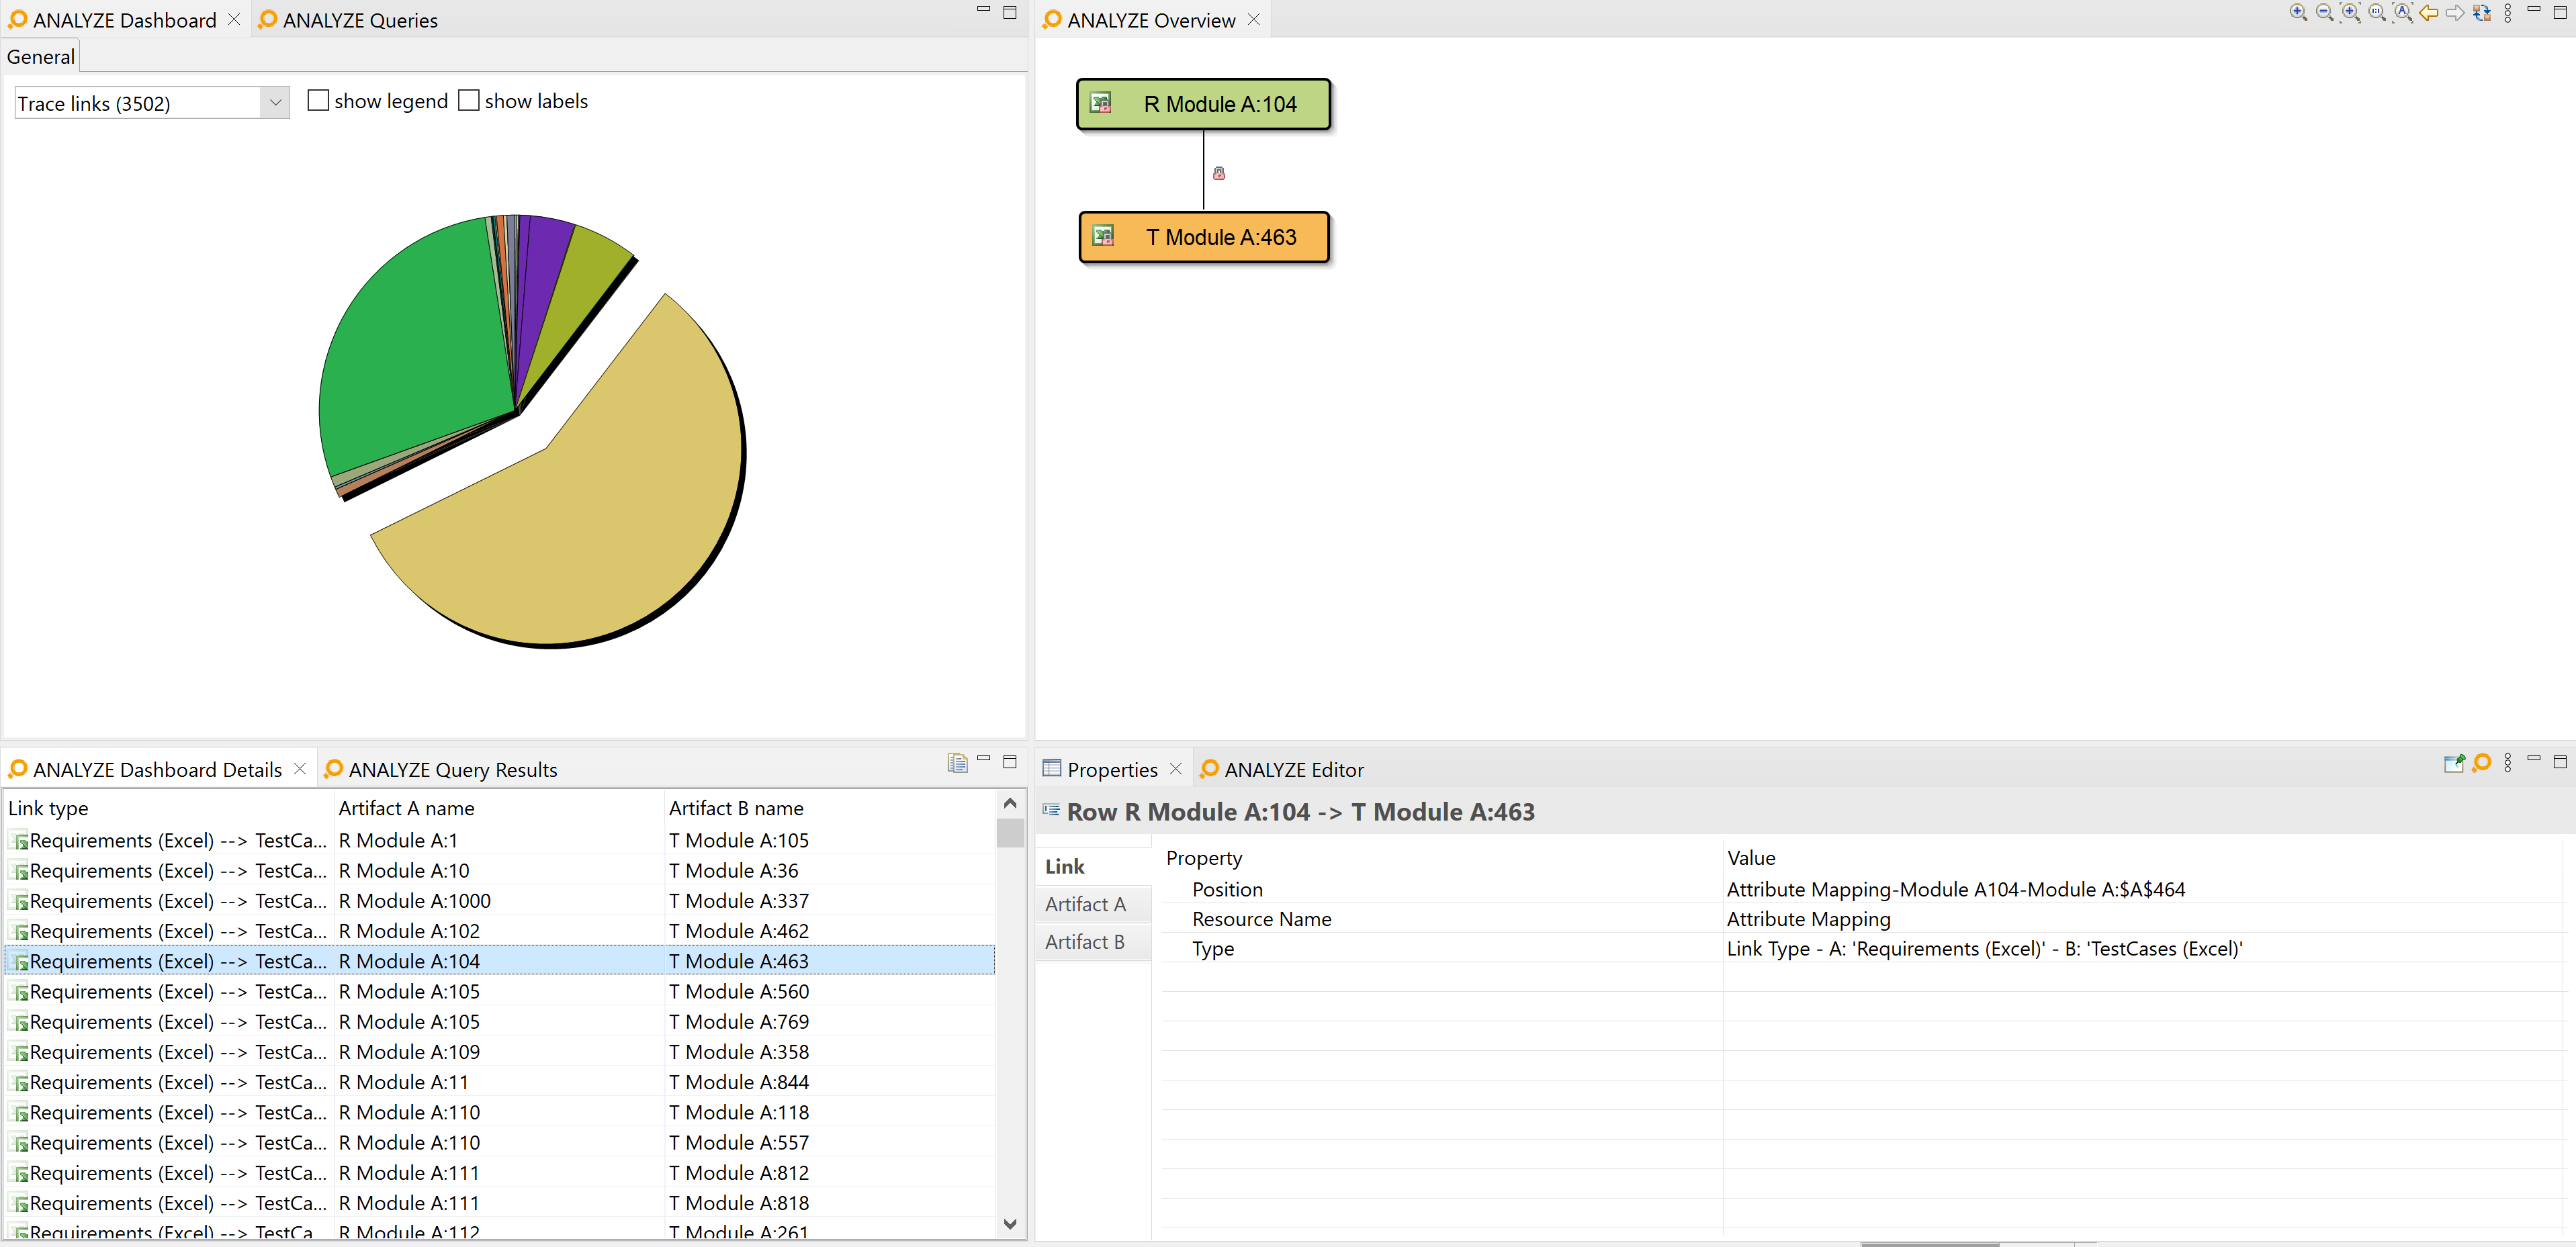
The Analysis perspective; using the dashboard
Section "The ANALYZE Dashboard view" has more details on using the dashboard.
Writing and running customized queries
While the dashboard application answers common questions, it does not cover any specific needs of your particular project. However, this can be addressed with customized queries. Figure "Writing and running queries in the Analysis perspective" shows an example:
- Hand-crafted queries in the ANALYZE query language have been established in a .query file (right). In this example, the idea is to trace stakeholder requirements to the results of software qualification tests, but only to those tests that have been executed successfully.
- The ANALYZE Queries view (top left) shows a tree view of query files (here: only one) and the queries therein.
- Double-clicking on a query executes it. Results are shown in the ANALYZE Query Results view (bottom left).
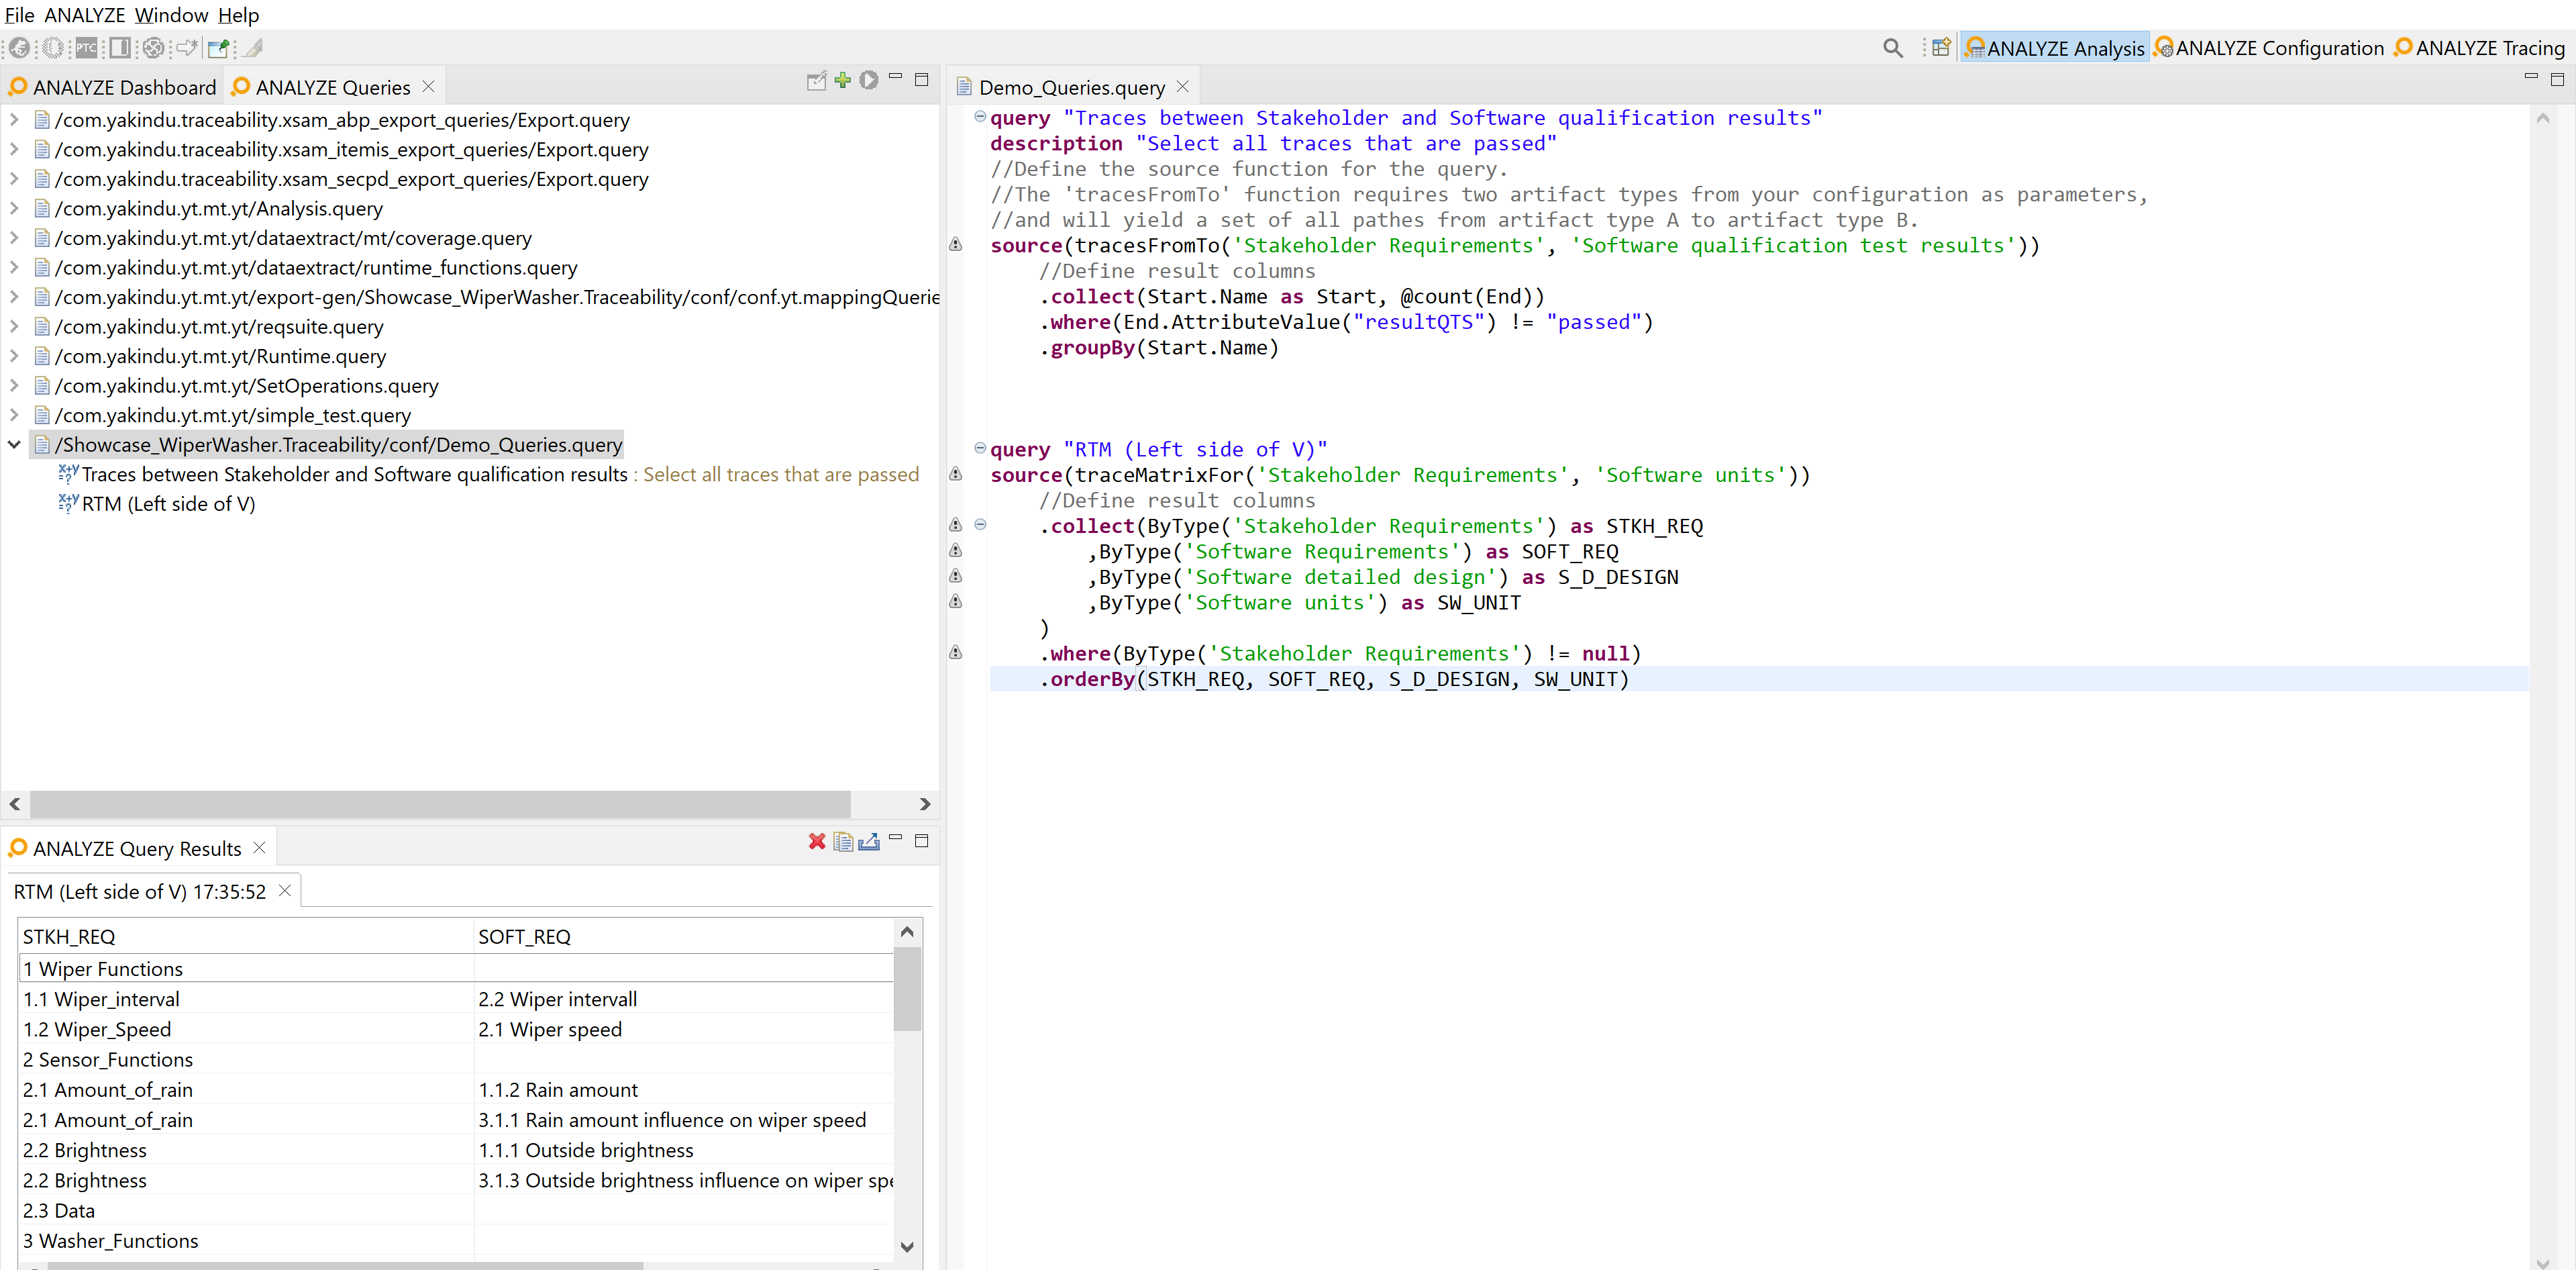
Writing and running queries in the Analysis perspective
Section "The ANALYZE Queries view and the ANALYZE Queries results view" has more details on working with customized queries.
Opening the "Analysis" perspective
To open the Analysis perspective, you have a couple of options:
- In the main menu, select ANALYZE → Perspective → Analysis.
- In the main menu, select Window → Open perspective → Other…. In the Open perspective dialog, select Analysis, and click on OK.
- If you have opened the Analysis perspective before, you can change to it by clicking on the Analysis button at the upper right of the itemis ANALYZE window.
In the Analysis perspective, you will find the ANALYZE Dashboard and the ANALYZE Queries tabs near the top-left corner of the itemis ANALYZE window. At least this applies to the default settings of the Analysis perspective. You can rearrange the views making up the Analysis perspective as you like and save the result as a new perspective or override the Analysis perspective's default settings.
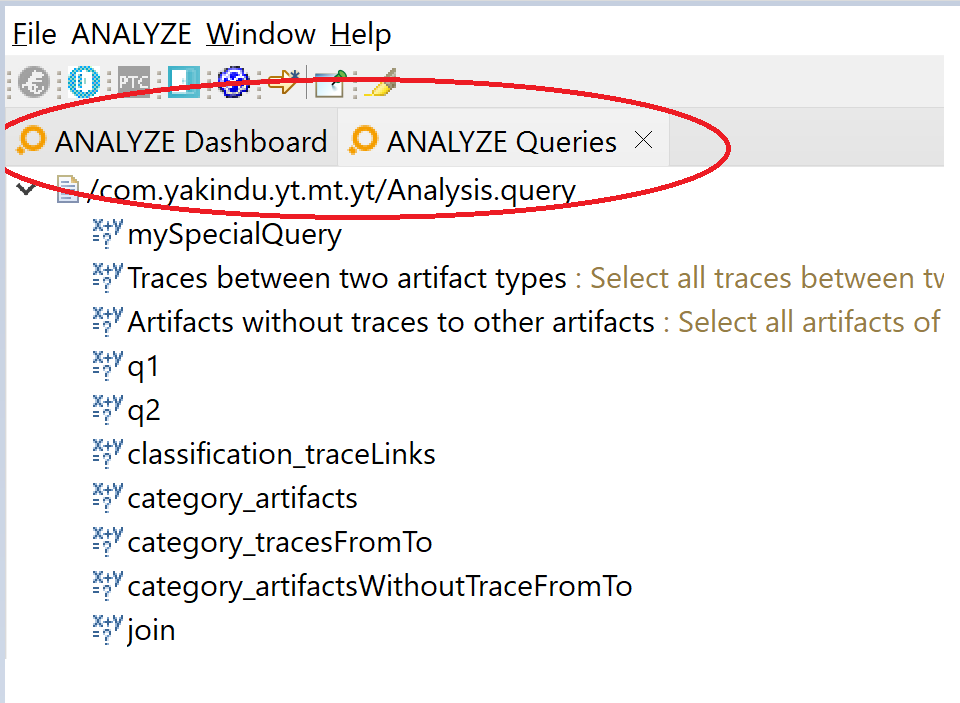
The ANALYZE Dashboard and ANALYZE Queries view tabs
The "ANALYZE Dashboard" view
The ANALYZE Dashboard provides a graphical overview of commonly-used traceability metrics for the current project.
Choosing the data to be displayed
By choosing an element from the drop-down menu in the top left corner of the ANALYZE Dashboard view, you can choose which data to display in the diagram:
- Trace links: Shows all available links, grouped by link type.
- Linked artifacts: Shows all available linked artifacts, grouped by artifact type.
- All artifacts: Shows all available artifacts, i.e., linked and not linked ones, grouped by artifact type.
- Not linked artifacts: Shows all available not linked artifacts, grouped by artifact type.
A counter right from each option in the drop-down menu indicated the number of links or artifacts found.
If you select a set of elements that is not empty, the dashboard displays a pie chart with an overview of these links or artifacts. It is grouped by link types resp. artifact types to give you an immediate visual impression of the element distribution in your project.
If there are no data available for the selected option, a notification will be shown in the center of the view.
Displaying legend and labels
Check the Show legend or Show labels checkbox near the top-right corner of the view in order to see which kind of elements each section of the pie chart represents. In figure "Pie chart and drop-down menu in the ANALYZE Dashboard view", both have been checked.
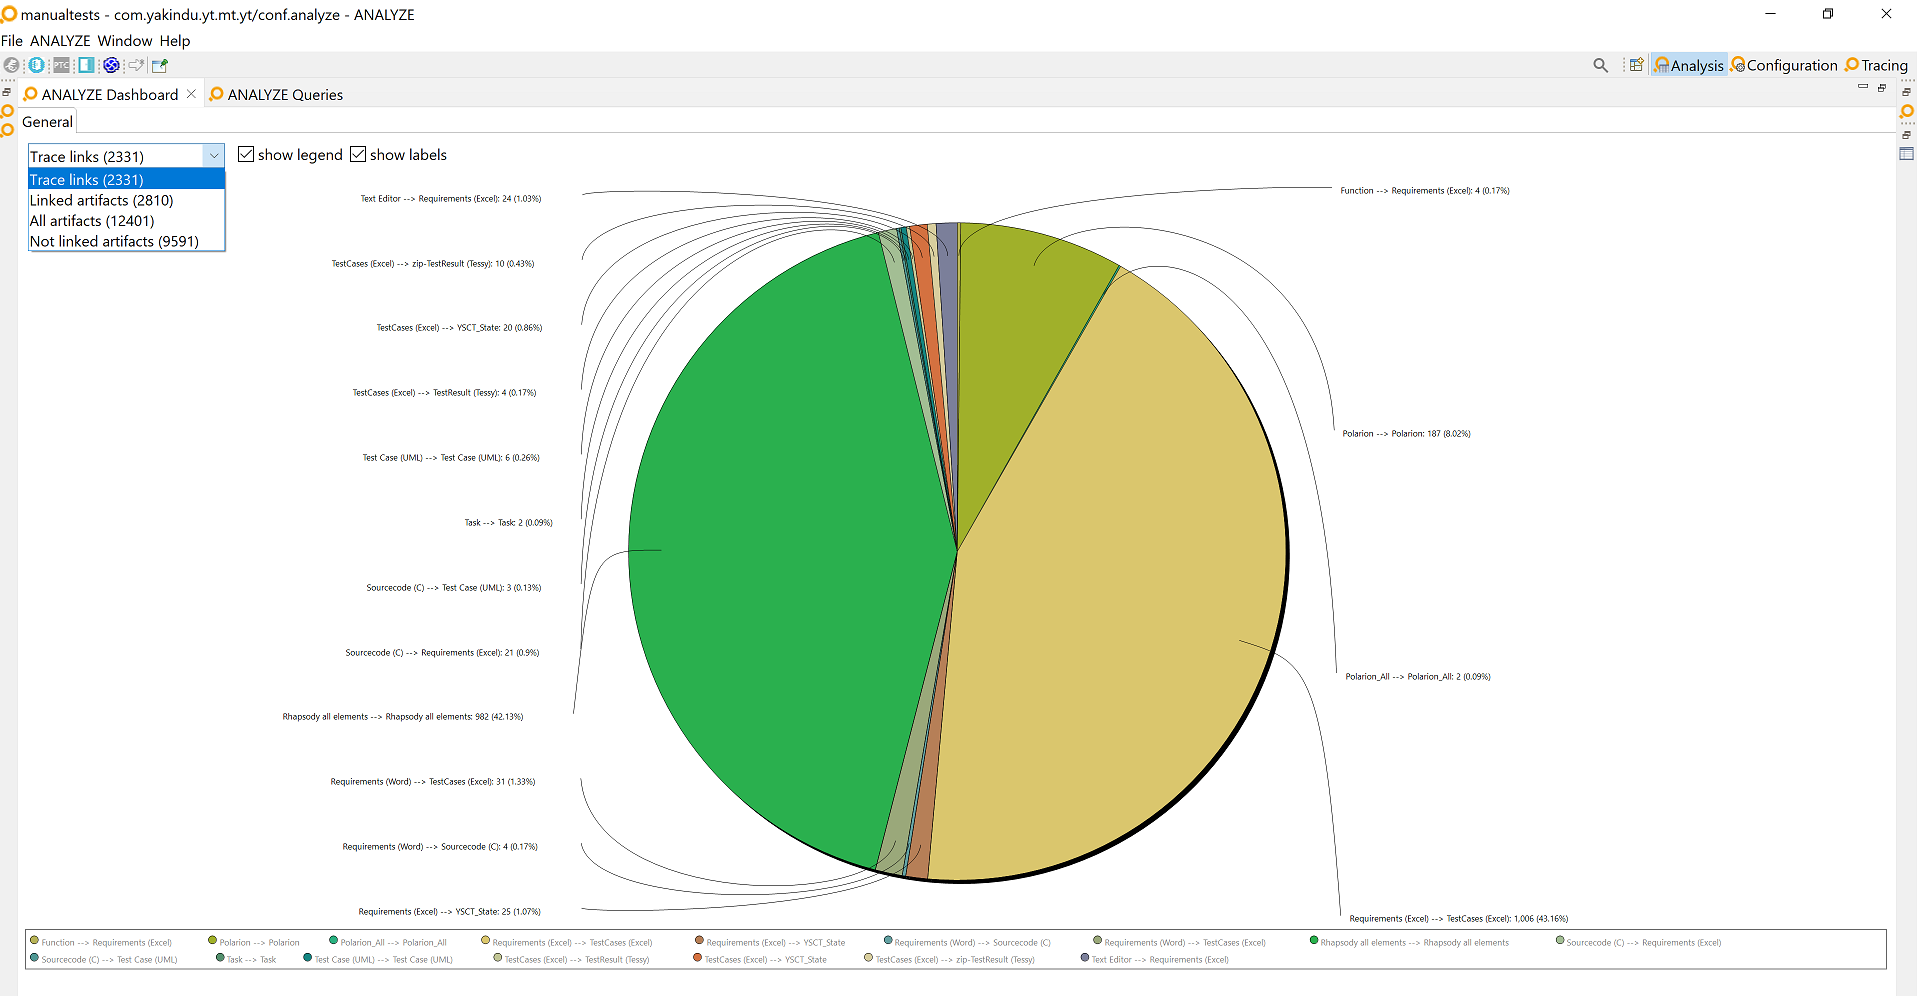
Pie chart and drop-down menu in the ANALYZE Dashboard view
The pie chart labels are showing element information of the following format: "name: count (percentage%)".
- name: name of the artifact/link type
- count: number of artifacts/links of this artifact/link type
- percentage: percentage of elements of this artifact/link type in relation to all elements shown
If you hover your mouse pointer over a pie section or legend item, a tooltip displays the element information in the format explained above.
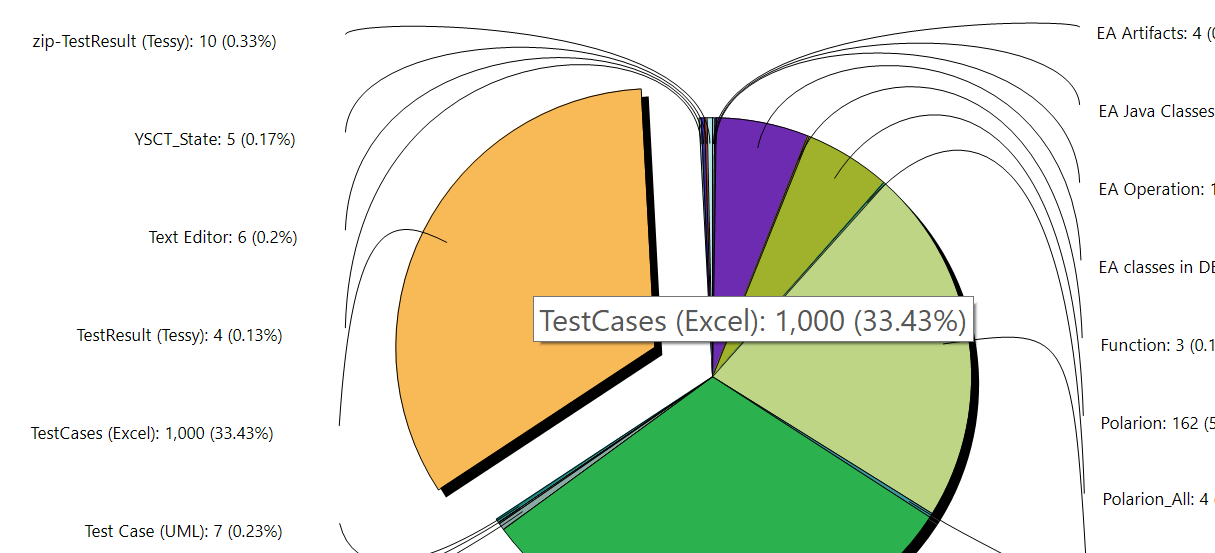
Pie chart section tooltip
Investigating links and artifacts in more detail
The pie chart is interactive: You can click on any of its sections (or on any legend entry) to investigate the corresponding elements in more detail. A click on a pie chart section explodes it, highlights the corresponding legend entry (if the legend is visible), and displays the elements the pie chart section represents in the ANALYZE Dashboard Details view. Click again, and the actions are reversed.
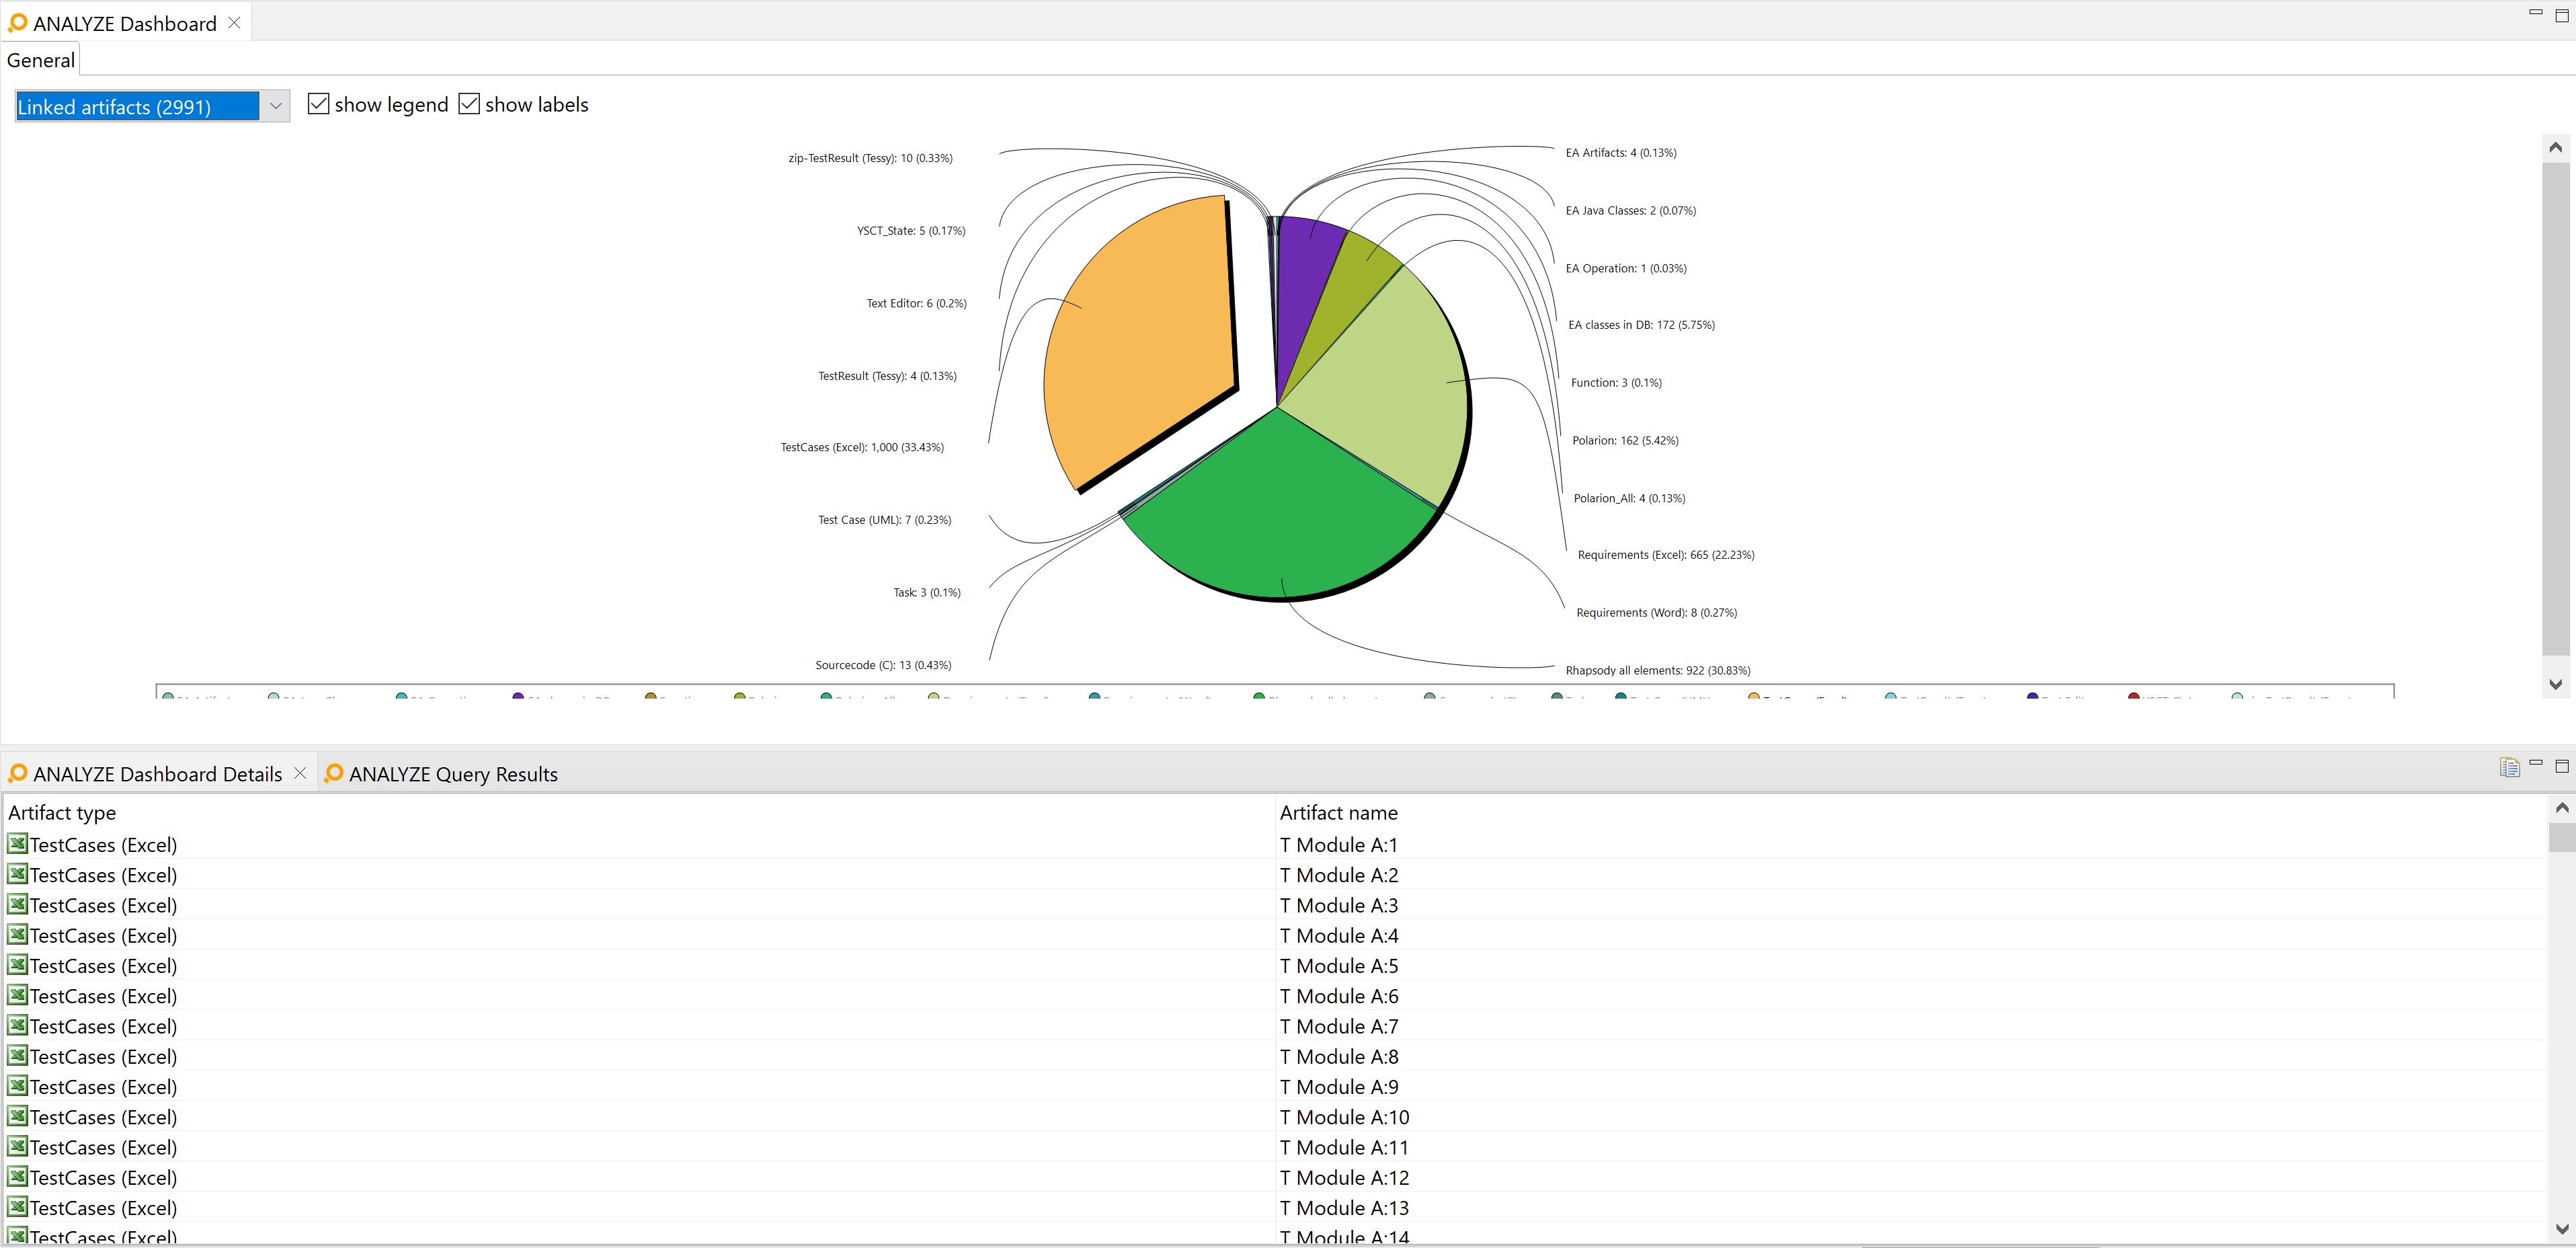
Interactive pie chart sections in the ANALYZE Dashboard view
The "ANALYZE Dashboard Details" view
The ANALYZE Dashboard Details view is linked to the ANALYZE Dashboard. As the name suggests, it displays details on the elements selected in the ANALYZE Dashboard view. In ANALYZE Dashboard, you select one or more types of artifacts or links, and in ANALYZE Dashboard Details, you can see all the artifacts or links themselves.
The ANALYZE Dashboard Details view displays elements, i.e., links or artifacts, as a table. Each row represents one element and provides information on it. Artifact information are type, name, and origin tools. For a link, the view displays its type and the artifacts at the link's ends.
If an element type is selected on the dashboard and the ANALYZE Dashboard Details view is closed, it will be opened. In any case, the ANALYZE Dashboard Details view will get the focus.
If no item is selected on ANALYZE Dashboard or the latter is closed, ANALYZE Dashboard Details provides either a clickable hint to open the dashboard or suggests to select a pie chart section.
Selecting an element in ANALYZE Dashboard Details displays its properties in the Properties view. If an artifact has been selected, the ANALYZE Overview view displays this artifact and its relationships to other artifacts. If a link has been selected, the ANALYZE Overview view displays its both link ends, i.e., the A and B artifacts, and their relationships to other artifacts.
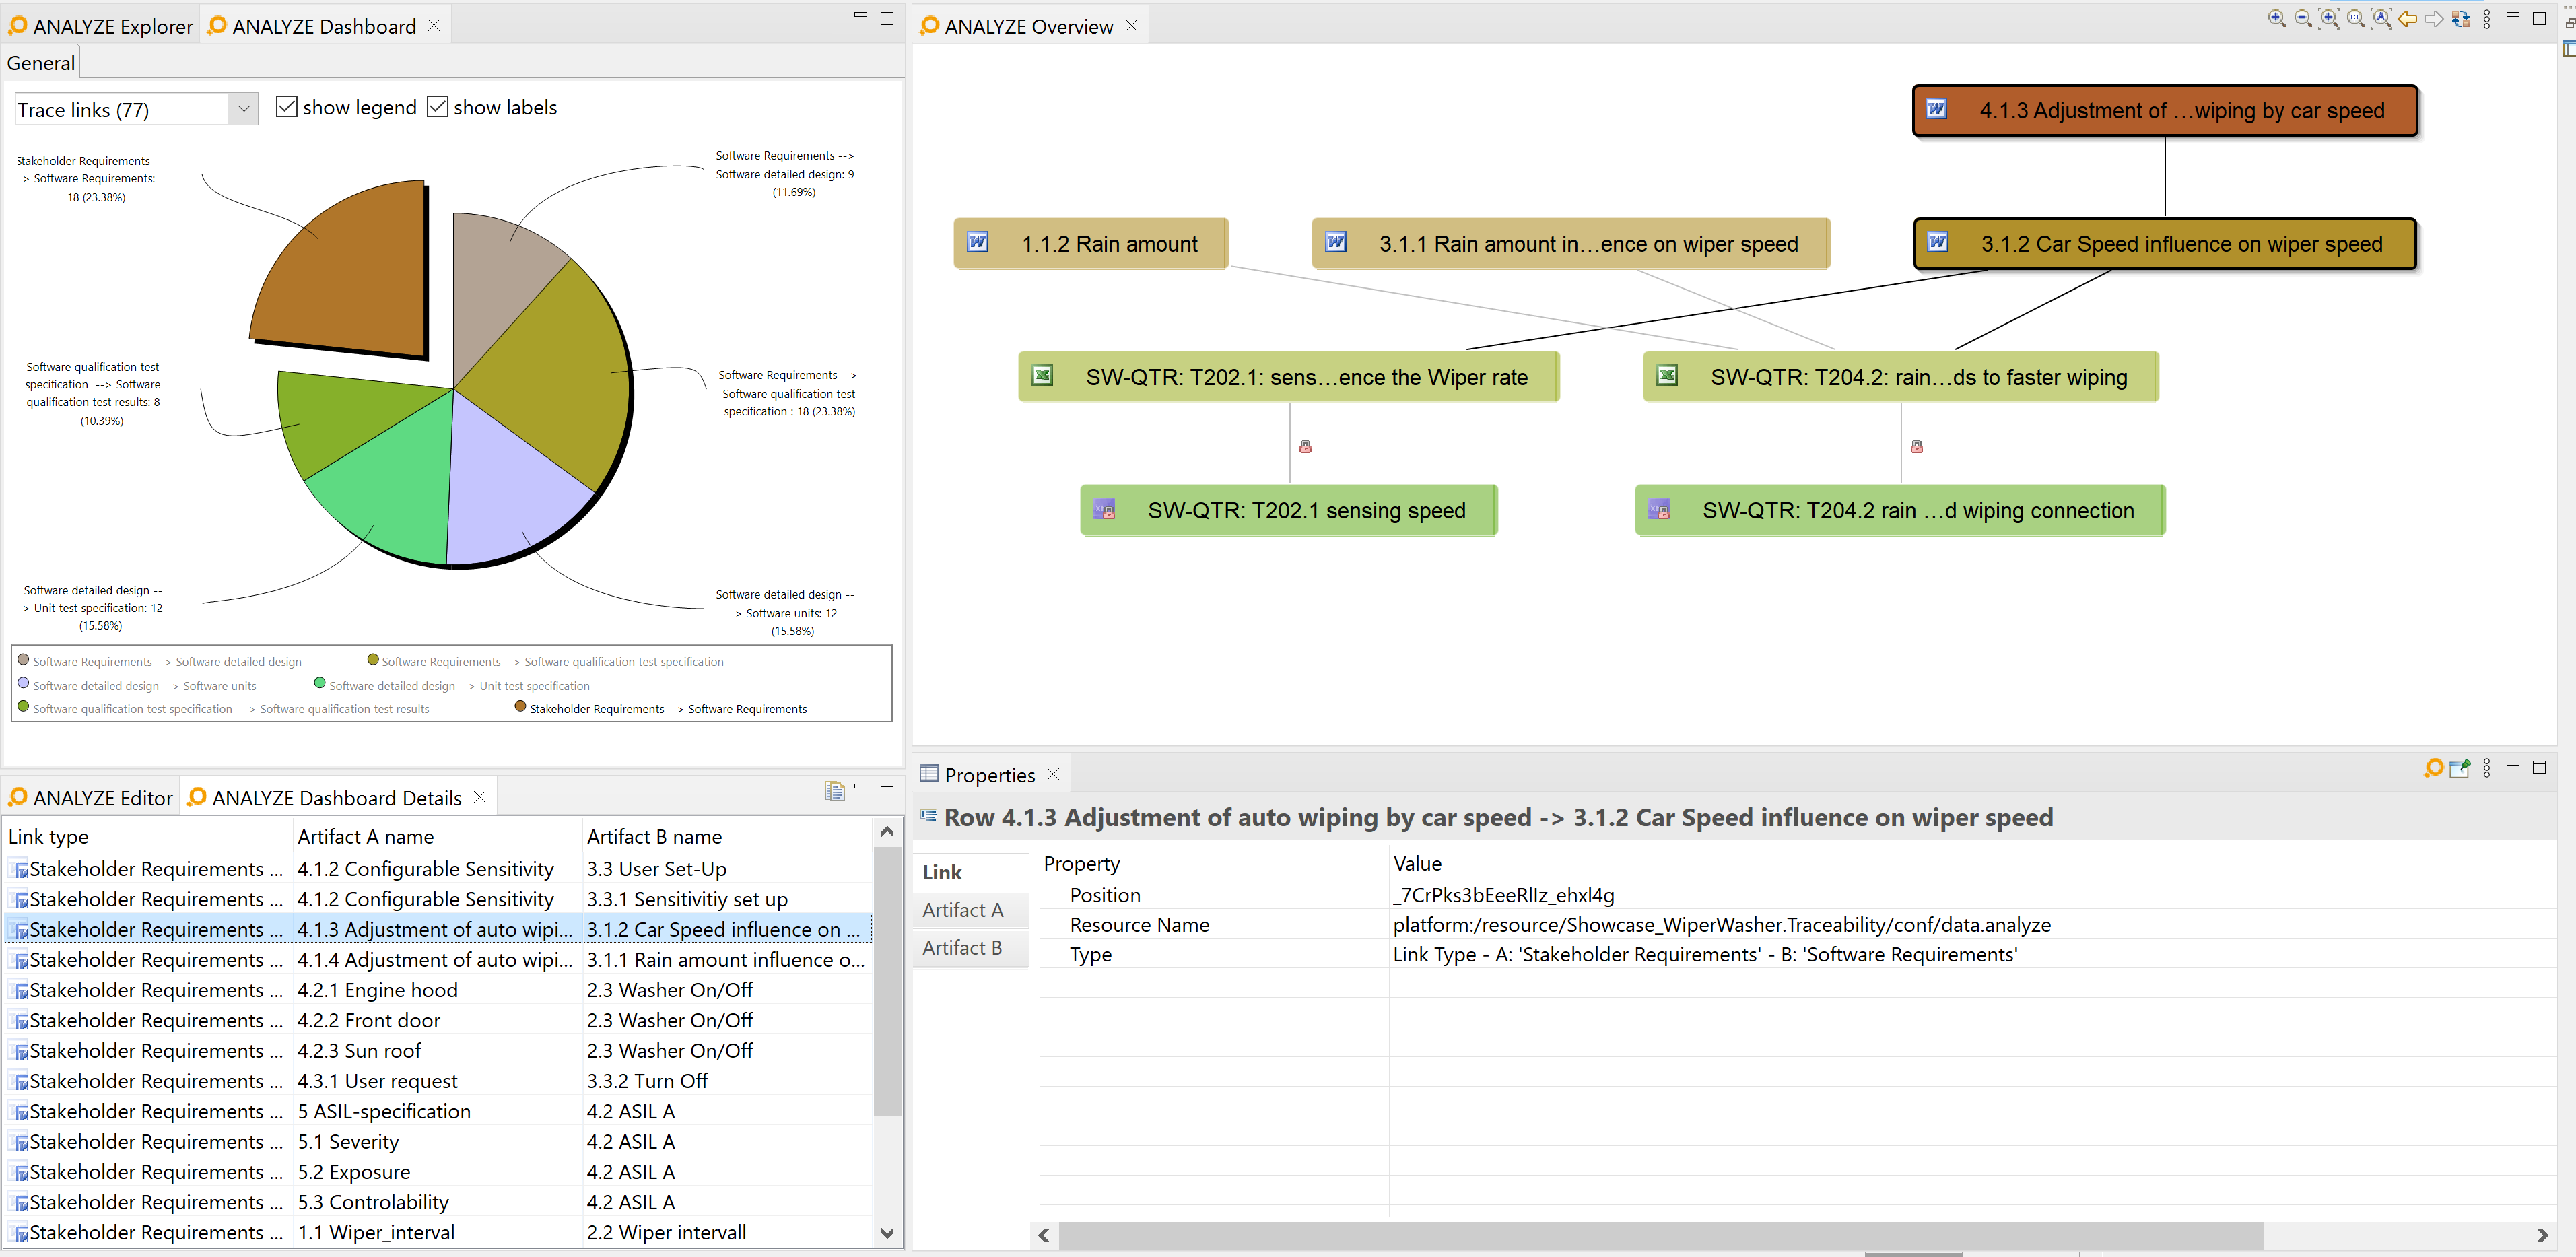
The ANALYZE Dashboard Details view
The ANALYZE Dashboard Details view provides a copy to clipboard  button at the right-hand side of its title bar. Select the table rows you are interested in – pressing
 [Ctrl+A] selects all rows –, then click on the copy to clipboard button. The table heading and the selected rows are copied to the clipboard as plain text. Within each line of this text, table cells are separated by [TAB] characters.
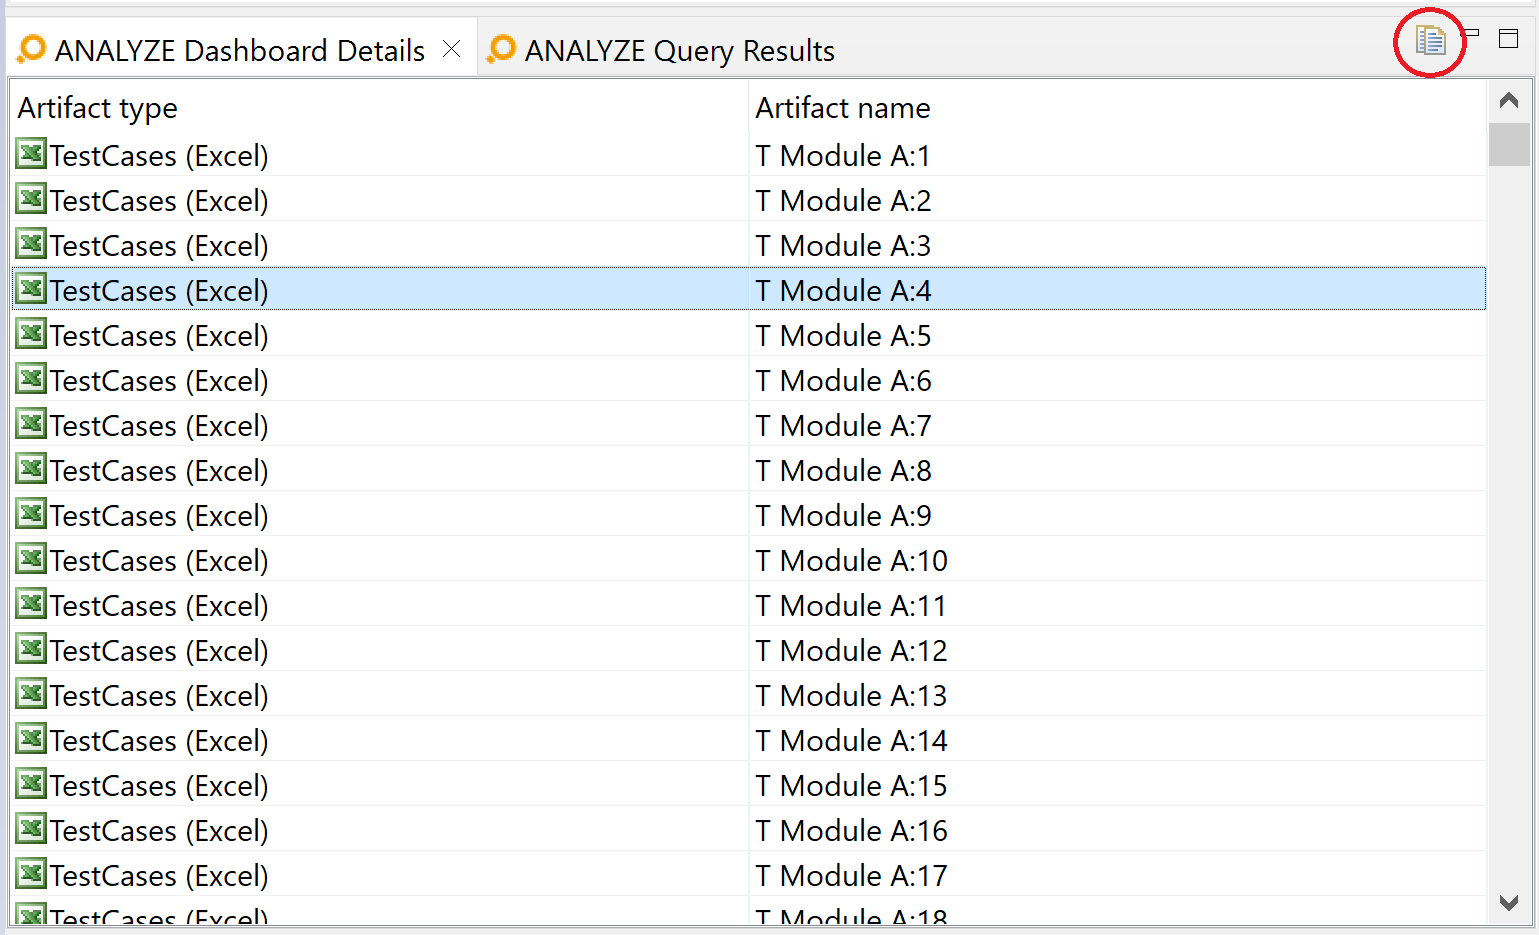
Location of the copy to clipboard button
Instead of using the copy to clipboard button, you can press [Ctrl+C] on the keyboard.
The "ANALYZE Queries" and "ANALYZE Query Results" views
The ANALYZE Queries and ANALYZE Query Results views operate in concert and allow you to create, edit, and execute queries as well as to view their results.
Queries and query files
Queries are stored in query files and displayed by the ANALYZE Queries view in a tree structure, with each query file at the top level, see the sample screenshot in the introductory section above.
The queries contained in a query file are shown as subordinate nodes of the respective file in the ANALYZE Queries view.
Query files must have the .query filename extension and can be stored anywhere in your workspace. A query file can contain multiple independent queries.
Initially, you don't have any query files, so the ANALYZE Queries view will be empty.
Queries have no side effects and will never manipulate any data they are executed on.
Creating a query file
You have several options to create a query file:
- Click on the
 icon at the top of the ANALYZE Queries view.
 - Select the New query file entry in the ANALYZE Queries view's context menu.
Both actions will open a file creation wizard asking for name and location of the file.
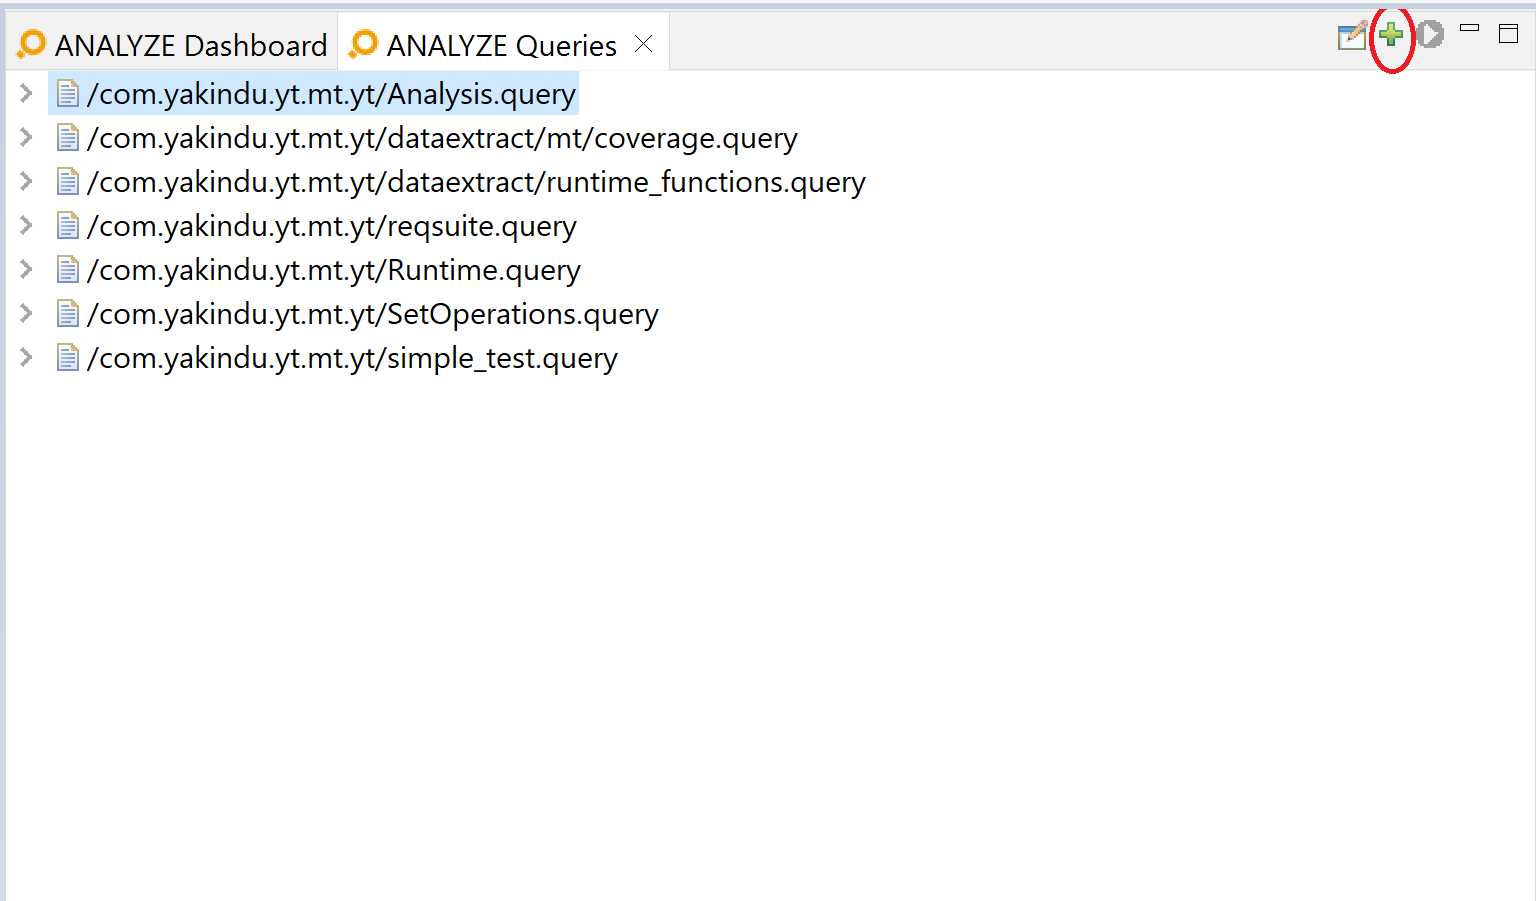
Creating a query file
After the query file has been created, itemis ANALYZE adds it to the ANALYZE Queries view and opens it in an editor. In this editor, you can formulate your queries, using the ANALYZE query language.
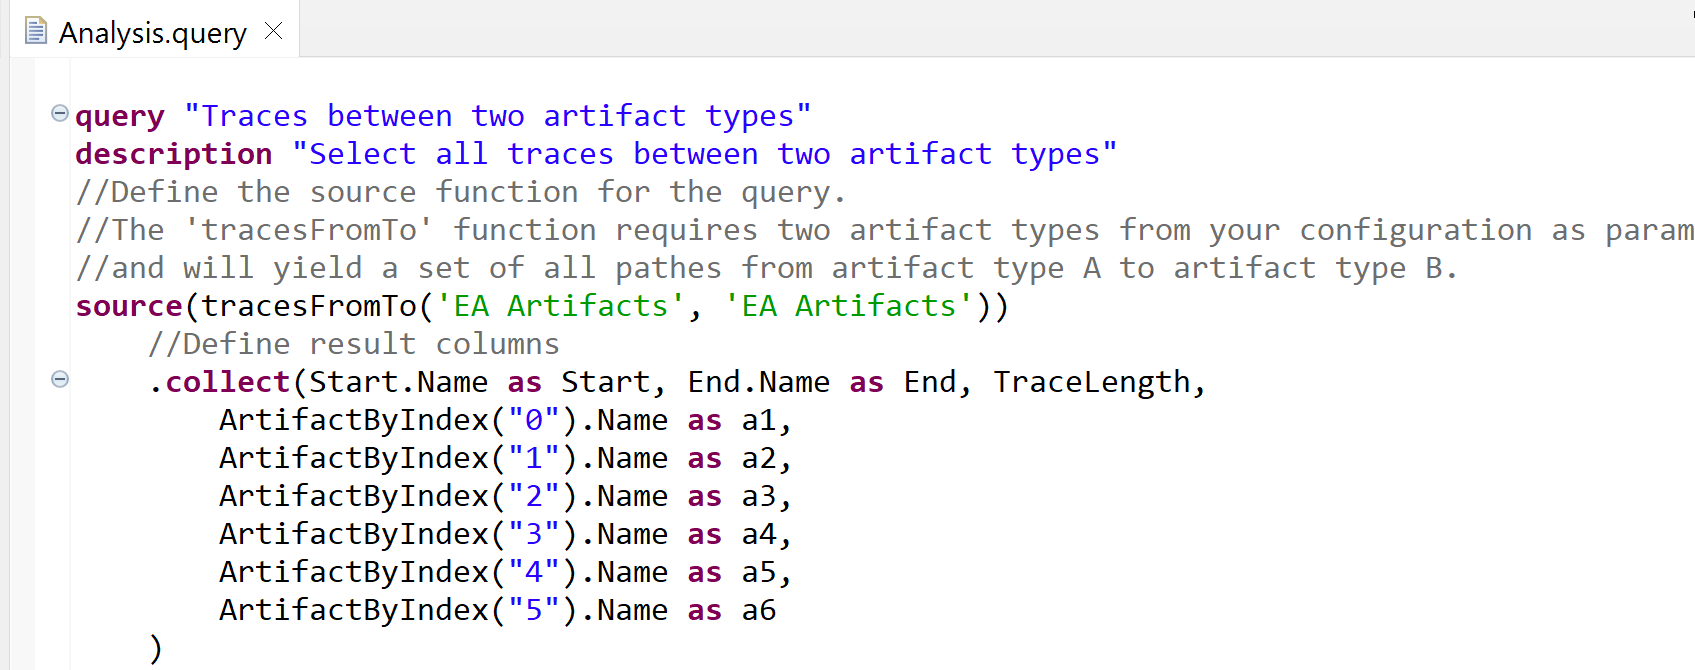
Editing queries
You can add as many queries as you want to a query file, but it is advised to maintain different queries in different files or at least maintain a clear structure, depending on your query's purpose and semantics.
Opening a query file
To open a query file, you have several options:
- Double-click on the query file in the ANALYZE Queries view.
- Right-click on the query file in the ANALYZE Queries view, then select Edit in the context menu.
- Select the query file in the ANALYZE Queries view, then click on the
 button at the top of the view.
The query file will be opened in the query editor.
Executing a query
You have the following options to execute a query:
- Double-click on the query in the ANALYZE Queries view.
- Right-click on the query in the ANALYZE Queries view, then select Execute in the context menu.
- Select the query in the ANALYZE Queries view, then click on the
 button at the top of the view.
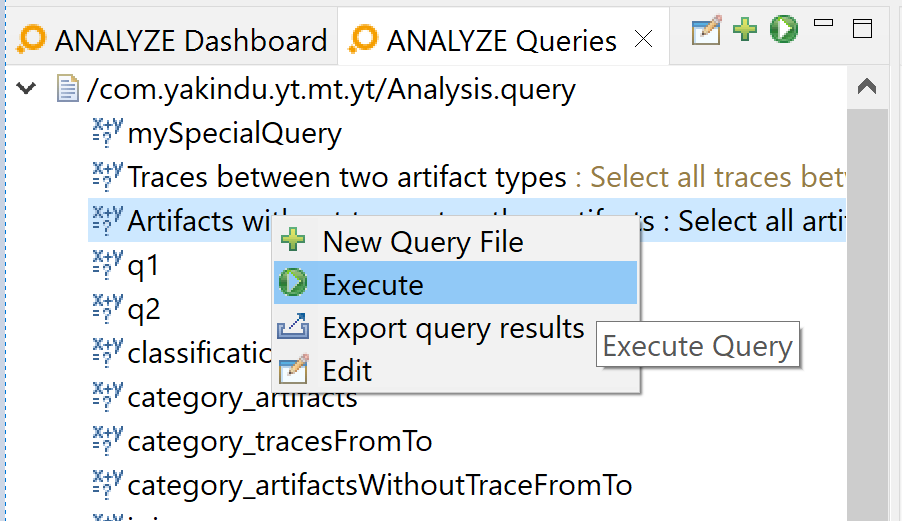
Executing a query
Inspecting query results
After executing a query, the ANALYZE Query Results view shows the results. Please note that some queries may take considerable time to execute, dependent on their complexity and on the size of your data model. A progress bar will inform you about the status of the query execution.
Each query execution adds a new result tab to the ANALYZE Query Results view. That is, you can execute the same query several times without loosing any results of formerly executed queries. To differentiate query results from each other, each result tab gets an individual name assigned, consisting of the query name and a time stamp.
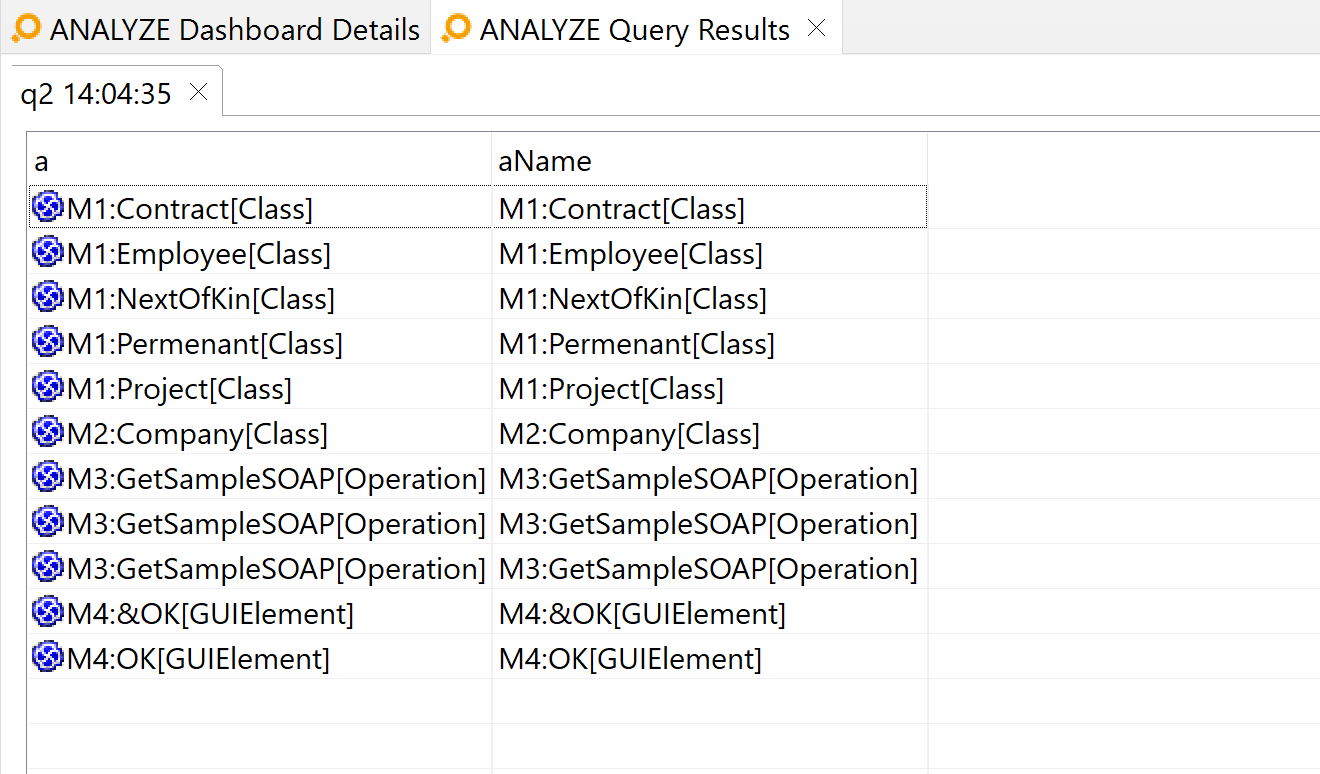
Inspecting query results
Exporting query results to Excel or CSV files
By default, query results are displayed in the ANALYZE Query Results view. However, it is possible to export them to a file, either to an Excel spreadsheet or to a CSV (Comma Separated Values) file. There are several ways to achieve this:
- From the ANALYZE Queries view: In the context menu of the query, select Export query results.
- From the ANALYZE Query Results view: Click on the toolbar button Export query results.
- From the ANALYZE menu: Select Reporting → Export query results.
In any case, you will be prompted with a dialog asking for some parameters:
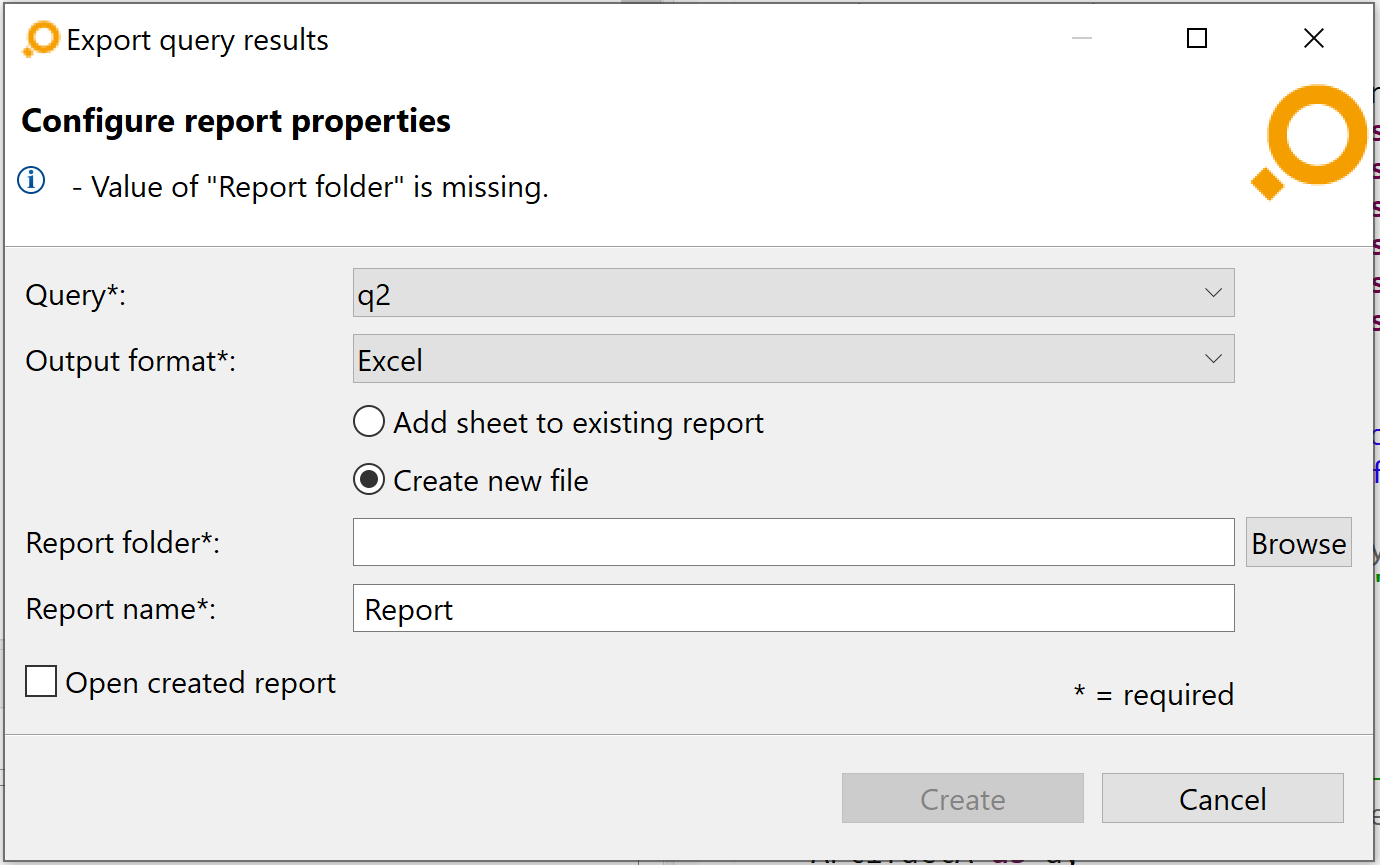
Exporting a query result
- Query: The query to be executed and whose results will be exported to an Excel or CSV document.
- Output format: Select the document format, either CSV or the Excel format .xlsx. However, please see option Report name below.
- Add sheet to existing report: If this option is selected, the report will be added as a new sheet to an existing Excel document. This option supports also append to files with the extension .xlsm, .xltx, and .xltm. It is not available for CSV export.
- Create new file: If this option is selected, a new document will be created. If the target document already exists, you will be asked for confirmation before overwriting the file. For CVS export, this option is automatically selected.
- Report folder: The folder the report file will be created in, overwritten in, or (in case of Excel) appended to. The folder must be located in an open project of the current workspace.
- Report name: The name of the report. This corresponds to the name of the Excel or CSV file that will be created or modified. It may optionally contain a filename extension, i.e., .xls, .xlsx, or csv. If a filename extension is specified, the Output format option will be ignored. If no filename extension is specified, the value will be automatically derived from the Output format option. If you selected a valid Report folder already, the drop-down menu will show the existing Excel and CSV files in that folder. This makes it easier to select a document to replace or append to.
- Open created report: Check this option to open the created report in Excel after the query results have been successfully exported.
If the Excel document is already open in Excel, itemis ANALYZE may not be able to write the file. In this case, a dialog will ask you to close the file in Excel and retry.
Adding derived attributes to the Artifacts
Attributes which are defined in an artifact type, but not mapped by any configuration of the type can be set by attribute queries. The query must collect one column named Artifact with the artifact itself, which should be updated, and one column per attribute which should be updated with the same name as the attribute. Missing attributes or mapped attributes in the configuration are ignored.
Example attribute query:
attribute query "testCoverage"
source (allArtifacts('Requirements (Excel)')).collect (
	it as Artifact,
	"passed by query result" as testCoverage
)
This Query will update the attribute testCoverage of all Requirements (Excel) to the fixed value "passed by query result".
The ANALYZE query language
The ANALYZE query language enables dedicated analysis of and specific information from the whole trace model (i.e., the graph of artifacts and links, including unlinked artifacts, attributes of artifacts, and attributes of links) which has been created by ANALYZE based on the configuration and the information that has been extracted from the various data sources.
Read an introduction to the ANALYZE query language and watch videos on how to create and execute your own queries in this blog post: "A language to analyze trace data efficiently".
Queries are processed by the ANALYZE query engine in three steps:
- Extract relevant data. Based on the definition of the query, ANALYZE evaluates the trace model and collects all matching result elements in a result model set that is specific for the given query. In contrast to an SQL result set, the result model set is not a tabular, flat sequence of data rows, but an object-oriented data model with entities of possibly different types and with relations between those entities.
- Flatten the result model set. This step transforms the result model set into a tabular result set with "data rows" of a homogeneous structure.
- Filter, aggregate, and sort data. Process the result set. This is similar to SQL.
ANALYZE query language elements
An ANALYZE query consists of up to six elements which are listed in the table below and are described in more detail in the subsequent sections.
| Language Element | Syntax | Description | Optionality |
|---|---|---|---|
| Query meta data | query "name" description "description"validation query "name"...private query "name"...attribute query "name"... | Defines the display name of the query and an optional description.
| the name is mandatory, markers private, validation, attribute and the description are optional) |
| Data source | source(expression) | Defines the algorithm a.k.a. query function which evaluates the trace model and returns a model set of result model set, i.e., the elements of the result set are not records, but objects, i.e., entities with attributes and relations. The expression may also contain parameters passed to the algorithm. This part can be roughly compared to the FROM clause of an SQL query | mandatory |
| Data transformation | collect(comma-separated feature selections) | Defines the transformation of the result model set into a result set. This part can be roughly compared to the SELECT clause of an SQL query. Similar to an SQL SELECT clause, it is possible to assign a name to the column of the result set by an optional AS customName as a suffix to one feature selection. With a prefix of @, it is also possible to use aggregator functions such as @sum. | mandatory |
| Filter | where(expression) | An expression restricting the rows of the result set | optional |
| Aggregation | groupBy(comma-separated feature selections) | Defines how the query results should be aggregated or projected. | optional |
| Ordering | orderBy(comma-separated feature selections) | Defines the order of the rows of the query result. | optional |
Elements of an ANALYZE query are separated by a . (dot), possibly with blank space left or right from the dot. An exception are query meta data and data source: These query elements are separated by blank space. This is illustrated by the following example which utilizes all language elements.
query "name" description "description of the query"
 source(someQueryFunction(parameter1, parameter2))
 .collect(attribute1 as A1, @sum(attribute2) as A2)
 .groupBy(attribute1)
 .orderBy(A2)
Source clause
The expression specified in a source(expression) clause links to an algorithm which processes the trace model and returns a set of result models. The algorithm itself is a so-called query function implemented in Java. The expression can pass parameters to the query function. ANALYZE does not restrict the types of the model elements of the result model set in any way.
A crucial characteristic of a query function is its return type. While ANALYZE does not restrict the element types of a result model set, all elements in the result model set of a given query are of the query function's return type.
As an example, ANALYZE provides the following query function:
Iterable<TVMDArtifact> allArtifacts(TVMCArtifactType type)
The allArtifacts function is one of ANALYZE's built-in query functions. The definition above shows that allArtifacts takes a single parameter of type TVMCArtifactType, which represents any artifact type. The result model set returned by allArtifacts contains all artifacts of the specified artifact type. It comes in the form of an Iterable of TVMDArtifact, i.e., as a sequence of zero or more TVMDArtifact objects, each of them representing an artifact of the specified type.
Consequently, an ANALYZE query using the allArtifacts function in a source clause, as in, e.g., source(allArtifacts('TestCase')), populates the result model set with matching TVMDArtifact elements, in this case with elements of type TestCase.
ANALYZE query clauses right from the source(allArtifacts(type)) clause operate on these elements. Like all TVMDArtifact, a TestCase has a name and a version. So a query like
query "simple example" source(allArtifacts('TestCase').collect(name as n, version as v)
creates a result set with columns n and v containing the name and the version of the TestCase artifacts.
Generally speaking, query clauses right from the source clause like collect, where, etc. are based on the element type of the result model set and consequently on the query function's return type. If, for example, you replace the query function expression allArtifacts('TestCase') by a different query function, say foobar('TestCase') with a different return type, the whole query might become invalid.
Apparently, being versed in the ANALYZE query language requires knowledge not only of the query language syntax, but also of available query functions, their return types, the specifics of these types, and the data model as a whole.
Please find a complete overview of the built-in query functions and their return types in section ANALYZE built-in query functions.
Extending the ANALYZE query language by custom query functions
Since ANALYZE recognizes query functions dynamically during runtime, it is easy to add custom query functions to ANALYZE and in this way extend the ANALYZE query language with evaluations that are specific to your development process.
Collect clause
A collect clause defines which attributes of the model elements returned by the query functions are taken over as a result set row of the ANALYZE query. A collect clause defines rules for the relevant attributes column by column, the rules being separated by comma. Each individual attribute is defined by navigating the attributes of an element of the result model set. The syntax is a dot-separated expression defining the access to attributes and getter functions, similar to, e.g., the C# programming language.
As an example, the query function tracesFromTo returns a set of traces.
- A trace has a start (of type Artifact)
- … which has a data source, representing, e.g., the file for a requirement extracted from a Microsoft Word document,
- … and an identifier, e.g., the name of the file.
So, a query like:
query "Requirements covered by test cases"
    source(tracesFromTo('Requirement', 'TestCase'))
    .collect(Start.DataSource.Identifier as FileName, Start.Name as ID)
returns a result set containing FileName and ID of Requirements which are (not necessary directly) linked to TestCases. A Requirement which has n TestCases assigned is listed n times in the result set.
Within a collect clause, you can not only access attributes, but also apply aggregator functions. As aggregator functions are making sense with an aggregation only, a groupBy clause is mandatory if using such functions. Available aggregator functions are:
| Aggregator function | Description |
|---|---|
@avg(expression), @max(expression), @min(expression), @sum(expression) | Calculates the average, maximum, minimum, or sum, respectively, in an aggregation. The specified expression must evaluate to a numeric value. |
@count(expression) | Counts the number of elements. The expression is irrelevant for counting the elements, but it must be specified and valid. For example, @count(1) would be perfectly sufficient for counting the elements. |
@countDistinct(expression) | Number of different values for the expression. |
@first(expression), @last(expression) | Returns the first resp. last element of an aggregation. |
@join(expression), @join(expression, separator) | Joins the elements of the expression to a string by using the separator string passed as the second argument or ',' if no delimiter is supplied. |
The functions @avg and @sum only work on numbers and strings that can be converted to numbers (both variants can be mixed arbitrarily). Their result is always a number. In case of @avg, the result will be rounded to 5 digits in the fraction. For example, @avg for (2.3 ,7, "1e-12") can be computed, but "1e-12" is too small to affect the result, because of the limit of digits in the fraction.
The functions @max and @min work on arbitrary parameters, but will work differently depending on the kinds of parameters. If all parameters are numbers or strings that are convertible to numbers, they will be compared numerically. If at least one of the parameters is not convertible to a number, the string representations for all parameters are compared alphanumerically. For example, the result of @min is 10 for ("x", 2, 10), while it is 2 for (2, 10). The result of @max for ("xa", "xb", "X", 1) is "xa", because lower case letters are alphanumerically larger than upper case letters.
Example: The query
query "Requirements covered by test cases"
    source(tracesFromTo('Requirement', 'TestCase' ))
    .collect(Start.Name as ID, @count(End) as Coverage)
    .groupBy(Start.Name)
returns a result set containing the IDs of Requirements and the number of (not necessary directly) linked TestCases.
Where clause
Values of a result set are matched against the boolean expression specified by a where clause. Within a where clause, boolean expressions can be combined using or or and logic. Grouping them by parenthesis (…) is supported. The available operators are as follows, in the order of highest to lowest precedence:
| Type | Operator | Description |
|---|---|---|
| Primary expression | (...) | Grouping |
| Primary expression | attribute | Attribute evaluation, see Collect clause |
| Primary expression | literal | false, true, null, number, string (between double quotes, e.g., "This is a string.") |
| Unary operators | !, -, + | Logical NOT, negative number, positive number |
| Multiplicative operators | *, /, % | Multiply, divide, modulo |
| Additive operators | +, - | Add, subtract |
| Relational operators | >=, <=, > , < | Larger than or equal, smaller than or equal, larger than, smaller than |
| Equality operators | ==, != | Equal, unequal |
| Logical AND operator | && | Combines two boolean expressions by a logical AND. The resulting expression evaluates to true if the combined conditions both evaluate to true, else false. |
| Logical OR operator | || | Combines two boolean expressions by a logical OR. The resulting expression evaluates to true if at least one of the combined conditions evaluates to true, else false. |
Example: The query
query "Requirements covered by manual test cases"
    source(tracesFromTo('Requirement', 'TestCase'))
    .collect(Start.Name as Id, @count(End) as Coverage)
    .where(Start.AttributeValue("Status") == "Verified" && End.AttributeValue("Execution Kind") == "Manual")
    .groupBy(Start.Name)
    .orderBy(Coverage)
finds all verified Requirements with their respective number of linked manual TestCases. The requirements are grouped by the name of their sources. Within each group they are ordered by their coverage, i.e., by the number of test cases assigned.
GroupBy clause
Every so often you are more interested in certain higher-level characteristics of a result set than in the individual members of a query result. A basic example would be to return the total number of requirements that are associated with at least one test case and the total number of those that don't.
This requires to first group the result set elements by an attribute like, say, hasTestCases, and then count the members of both groups using the @count aggregator function. Such a group is called an aggregation.
Another example is shown near the end of the Collect clause section above. The query function tracesFromTo('Requirement', 'TestCase') returns all traces from requirements to directly or indirectly associated test cases. Requirements having multiple test cases appear multiple times in the resulting traces. Now essentially two things happen:
- The
groupBy(Start.Name)puts all trace elements with identical requirement names into a group of their own, respectively. That is, if a requirement has, say, five test cases, then five of the trace elements returned by the query function will contain that requirement as their start attribute. These trace elements will be grouped into an aggregate of their own, just like other trace elements with identical requirement names. - In the
collect(Start.Name as Id, @count(End) as Coverage)clause, the@count(End)aggregator function is particularly interesting, because it counts the elements in each aggregation. The samplecollectclause creates a result set with two columns: Column Id holds the requirement names, and column Coverage holds the number of test cases for each of those requirements.
Aggregator functions work on aggregations and thus require a groupBy clause to be present in the ANALYZE query.
It is possible to group a result set by more than just one criterion. Multiple feature selections are specified as a comma-separated list, e.g., groupBy(A, B, C).
OrderBy clause
The orderBy clause is used to sort the result set by one or more columns. An example is given in section Where clause.
ANALYZE built-in query functions
ANALYZE comes with a lot of built-in query functions. As foreshadowed in section ANALYZE query language elements, these functions do not return plain data records, but a set of result models, e.g., models containing instances of artifacts and links. The result models returned by the built-in ANALYZE query functions are all based on the same meta-model. The returned models are complete; if, e.g., a function returns a set of links, it is possible to navigate from such a link first to the artifact at end A and then from there to the artifact type.
Built-in query functions are useful tools for establishing traceability matrices, among other things. Learn what a traceability matrix is and what it is good for in the blog posts "5 + 1 questions a requirements traceability matrix answers" and "How to create a requirements traceability matrix in Excel".
List of built-in query functions
| Function | Description | Parameters ?: optional +: at least one | Return type, i.e., set of … | Example |
|---|---|---|---|---|
| allArtifacts | Finds all artifacts or all of a given type or category. | Type?: ArtifactType or Category | Artifact | source(allArtifacts('TestCase')).collect(Name)Returns all names of all test cases. |
| allArtifactTypes | Lists all artifact types specified in the ANALYZE configuration. | – | ArtifactType | source(allArtifactTypes()).collect(Name)Returns all names of all artifact types. |
| allLinkTypes | Lists all link types specified in the ANALYZE configuration. | – | LinkType | source(allLinkTypes()).collect(Name)Returns all names of all link types. |
| allTraceLinks | Lists all links or all of a given type or classification | Type?: LinkType or Classification | Link | source(allTraceLinks('Requirement --> Test')).collect(ArtifactA.Name as Req, ArtifactB.Name as verifiedBy)Returns both ends of all links between requirements and tests. |
| artifactsWithoutTraceFromTo | Finds all artifacts of one type or category that have no traces to any artifact of a second type or category. When a category is used as a parameter, the paths are computed for every combination of an artifact type of that category with the artifact type(s) defined by the other parameter. | TypeA: ArtifactType or Category TypeB: ArtifactType or Category | Artifact | source(artifactsWithoutTraceFromTo('Customer Requirement', 'Test Result')).collect(Name)Returns all customer requirements without any assigned test results. "Assigned" in this case means "reachable via a chain of links", e.g., from Customer Requirement to System Requirement to System Test Case to Test Result. |
| countTracesFromTo | Count all traces (i.e., chained trace links) between artifacts of two artifact types/categories. When a category is used as a parameter, the paths are computed for every combination of an artifact type of that category with the artifact type(s) defined by the other parameter. The trace contains only the count of traces and the start and the end, but no intermediate artifacts. | TypeA: ArtifactType or Category TypeB: ArtifactType or Category | Trace | source(countTacesFromTo('Customer Requirement', 'Test Result')).collect(Start.Name, End.Name, Count)Returns all customer requirements with trace to a test result and the number of traces between them. |
| intersection | Creates the intersection of two or more query results. Rows of the results are identical when all columns and values are identical. | Query1: QueryResult Query+: QueryResult | QueryResult | source(intersection(q(q1), q(q2))).collect(column("artifact") as Artifact, artifact("artifact").Type as ArtifactType)Returns a query result that contains the "artifact" column for all elements contained in the query results of both q1 and q2 and their types. |
| join | Joins two query results (i.e., from q). | Query1: QueryResult column1: ColumnName Query2: QueryResult column2: ColumnName | QueryResult | source(join(q('q1'), "artifact", q(q2), "start")).collect(left("Name") as name, right("End") as end)Join results of query "q1" by values of column "artifact" of "q1" with the results of query "q2" by equal values in column "start" of "q2". Returns the "Name" of "q1" and all "End"s for these artifacts in "q2". If one value in not in the other query results, the row is joined with empty values. |
| linkedArtifacts | Finds all artifacts of a given type that have at least one link. | Type?: ArtifactType or Category | Artifact | source(linkedArtifacts('TestCase')).collect(Name)Returns all names of all linked test cases. |
| notLinkedArtifacts | Finds all artifacts (of a given type) that have no link. | Type: ArtifactType | Artifact | source(notLinkedArtifacts('TestCase')).collect(Name)Returns all names of all test cases which are not linked. |
| q | Get the result of one query as input for another one like join or union. | Query: Query | QueryResult | source(q('AnotherQuery')).collect(column("Name") as name)Returns the column "Name" from "AnotherQuery". |
| reduceBy | Subtracts the query results given after the first parameter from the query result given as first parameter. Rows of the results are identical when all columns and values are identical. | Query1: QueryResult Query+: QueryResult | QueryResult | source(reduceBy(q(q1), q(q2))).collect(column("artifact") as Artifact)Returns a query result that contains the "artifact" column for all elements contained in the query result of q1, but not in that of q2. |
| tracesFromTo | Finds all traces (i.e., chained trace links) between artifacts of two artifact types/categories. When a category is used as a parameter, the paths are computed for every combination of an artifact type of that category with the artifact type(s) defined by the other parameter. | TypeA: ArtifactType or Category TypeB: ArtifactType or Category | Trace | source(tracesFromTo('Customer Requirement', 'Test Result')).collect(Start.Name, @count(End)).groupBy(Start.Name)Returns all customer requirements with at least one assigned test result and the number of these assigned test results. "Assigned" in this case is defined as above. |
| traceMatrixFor | Calculates all possible traces between two artifact types, while also considering incomplete, or interrupted traces. In the collect clause, you can access the attributes of artifacts in the trace. To access all artifacts, use ArtifactsByType(type). You can also access the first, last, or Nth artifact in the trace with FirstArtifactByType(type), LastArtifactByType(type), and ArtifactNByType(type, index). | TypeA: ArtifactType TypeB: ArtifactType | Compressed Trace | source(traceMatrixFor('Customer Requirement', 'Test Result')).collect(ByType("Customer Requirement"), ByType("Software Requirement"), ByType("Implementation"), ByType("Test Case"), ByType("Test Result"), ArtifactsByType("Test Result").AttributeValue("result"))Assuming that the trace model looks as follows: "Customer Requirement" → "Software Requirement" → "Implementation" → "Test Case" → "Test Result". The result will contain all distinguished traces between each and every artifact in the chain. Also unlinked artifacts are included. The last column contains the values of the custom attribute "result" for each "Test Result" artifact in the trace. |
| union | Creates the union of the given query results, i.e., the set of elements that are contained in either of the results. Duplicates are discarded, so when there are several identical elements in the results, only one is retained. Elements are considered identical, if all columns and values in their respective rows are identical. Elements are not guaranteed to be in any particular order. | Query+: QueryResult | QueryResult | source(union(q(q1), q(q2))).collect(column("artifact") as Artifact)Returns a query result that contains the "artifact" column for all elements in the query results of q1 or q2. Each element is contained only once. |
| unionAll | Combines the given query results by appending the elements of the second result to the elements of the first result. All duplicates are retained, and they remain in their original order. | Query+: QueryResult | QueryResult | source(unionAll(q(q1), q(q2))).collect(column("artifact") as Artifact)Returns a query result that contains the "artifact" column for all elements in the query results of q1 or q2. Duplicates are not removed. |
| statistics | Provides information regarding count of artifacts/links per ArtifactType/LinkType in the ANALYZE configuration. | – | Statistics | source(statistics()).collect (Name as Name, Count as Count)Returns name and count of artifacts/links per ArtifactType/LinkType. Result can be filtered out only for ArtifactTypes using the filter as shown source (statistics).collect (ArtifactType as Name, Count as Count).where (LinkType == null) similarly source (statistics).collect (LinkType as Name, Count as Count).where (ArtifactType == null) can be used to filter out only LinkTypes |
Query result meta model
For the results of the built-in ANALYZE query functions the most important domain objects and their relations are illustrated and described below.
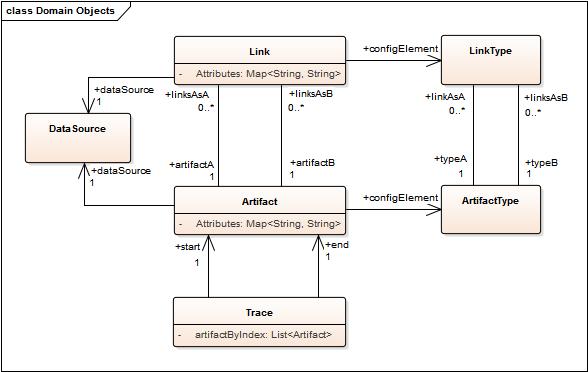
DataSource: Represents the origin from which artifacts or links have been extracted. For the Microsoft Word Adapter, for example, a DataSource represents the Microsoft Word Document. For the IBM DOORS adapter, the DataSource represents the DOORS module.
Attributes:
- identifier: The name of the DataSource
Link: A single trace link between two artifacts.
Relations:
- artifactA: The "A" end of the link
- artifactB: The "B" end of the link
- configElement: The defining link type from the ANALYZE configuration
- dataSource: The origin or storage medium of the link
Attributes:
- Attributes: A map containing the attributes of the link (as defined in the ANALYZE configuration of the link type). The values of this map are accessible by means of function AttributeValue(key) in the query language, e.g.,
collect(… AttributeValue("my custom Attribute") as MyCustomAttribute). - versionA: The version of artifactA at the time of link creation / last link update
- versionB: The version of artifactB at the time of link creation / last link update
Artifact: Represents a traceable artifact that may or may not have links.
Relations:
- configElement: The defining link type from the ANALYZE configuration
- dataSource: The origin or storage medium of the link
- linksAsA: All links where the given artifact has the role ArtifactA
- linksAsB: All links where the given artifact has the role ArtifactB
Attributes:
- Attributes: A map containing the attributes of the link (as defined in the ANALYZE configuration of the link type). The values of this map are accessible by means of function AttributeValue("key") in the query language, e.g.,
collect(… AttributeValue("my custom Attribute") as MyCustomAttribute ). - name: The name of the artifact
- position: The information where the artifact is located in its data source. For example, for IBM DOORS, the position of a requirement is the absolute number.
- version: The current version of the artifact. The algorithm for version calculation depends on the technology of the adapter, e.g., for Microsoft Excel, the version is the union of the values of all configured attributes. For PTC Integrity, the version is the modifiedDate of the item being represented by the artifact.
Trace: Represents a chain of linked artifacts, i.e., the nth artifact in the chain has a direct link from the artifact at position n-1 and a direct link to the artifact at position n+1.
Relations:
- start: The first artifact of the chain
- end: The last artifact of the chain
Attributes:
- TraceLength: The number of links in the chain
- ArtifactByIndex(int n): The nth artifact in the chain. The index is zero-based, i.e.,
ArtifactByIndex(0)equalsStart. Negative numbers are evaluated from the end, i.e.ArtifactByIndex(-1)equalsEnd.
Functions:
| Function | Description | Parameters ?: optional +: at least one | Return type, i.e., set of … | Example |
|---|---|---|---|---|
| containsArtifactType | Decides whether a specific artifact type is included in the query results. Often used in a where clause | Type?: ArtifactType or Category | Boolean | source(tracesFromTo('Customer Requirement', 'Test Result')).collect(Start.Name, @count(End)).where(containsArtifactType('Software Requirement'))Returns all customer requirements with at least one assigned test and at least one assigned software requirement and the number of these assigned test results. „Assigned” in this case is defined as above. |
| containsLinkType | Decides whether a specific link type is included in the query results. Often used in a where clause | Type?: LinkType or Classification | Boolean | source(tracesFromTo('Customer Requirement', 'Test Result')).collect(Start.Name, @count(End)).where(containsLinkType('Software Requirement --> Software Requirement') == false)Returns all customer requirements with at least one assigned test and at least one linked software requirement and the number of these assigned test results. Thereby software requirements which are linked to each other are ignored. „Assigned” in this case is defined as above. Thereby ignoring |
LinkType: Reflects an artifact type specified in the ANALYZE configuration.
Relations:
- typeA: The artifact type specified as artifact type A
- typeA: The artifact type specified as artifact type B
Attributes:
- classification.name: The classification as specified in the ANALYZE configuration
- name: A string representation of the linked type (which in the main part consists of the names of the linked artifact types)
- roleA.name: The role of end A as specified in the ANALYZE configuration
- roleB.name: The role of end B as specified in the ANALYZE configuration
Note: From a technical point of view, the above-listed attributes of a link type are not shallow attributes, but attributes of related objects, e.g., the attribute classification.name is the name of the classification the link type is related to. Nevertheless, from a domain point of view, "attributes of related objects" can be viewed as attributes of the link type.
ArtifactType: Reflects an artifact type specified in the ANALYZE configuration.
Relations:
- linksAsA: All link types where the given artifact type has the role typeA
- linksAsB: All link types where the given artifact type has the role typeB
Attributes:
- category: The category as specified in the ANALYZE configuration
- providerName: The name as specified in the ANALYZE configuration
Creating reports
The report wizard can be accessed by navigating to the menu entry
ANALYZE → Reporting → Create report
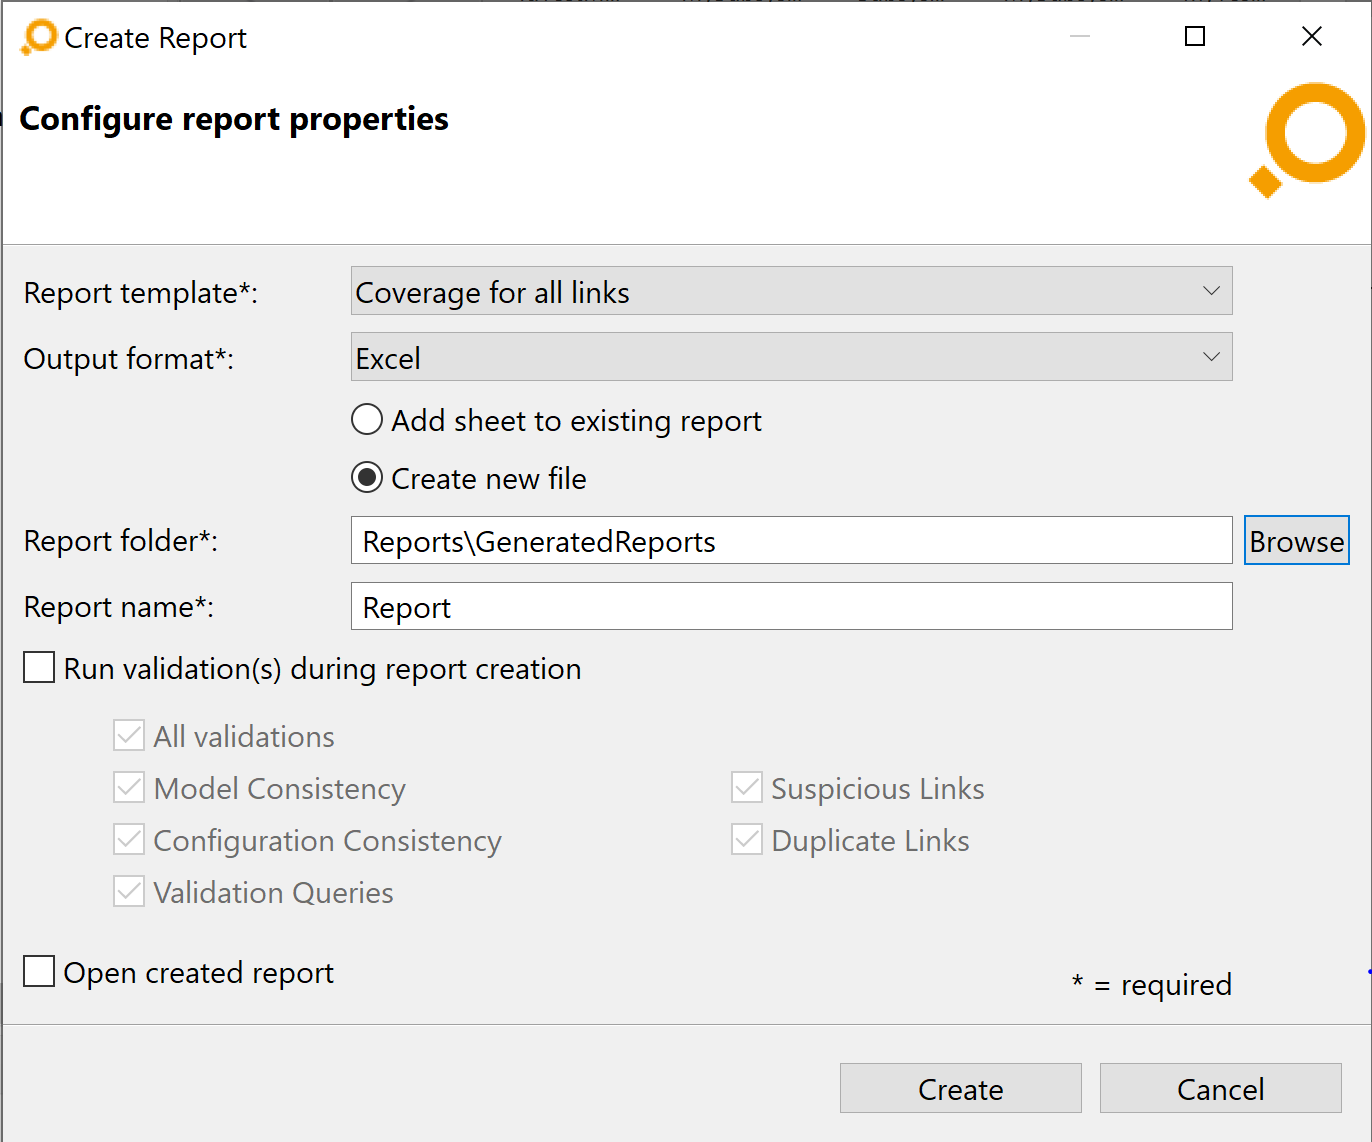
The default report shows simple traceability statistics only. Further reports (e.g., coverage analysis report) have to be implemented by the end users. The reporting is based on Eclipse BIRT (Business Intelligence and Reporting Tools). Reports can be designed with the BIRT WYSIWYG Designer. ANALYZE comes with data access drivers for BIRT to provide convenient access to analysis data.
You have the option to select one or several validations to be executed before the report creation. This is to ensure that the report is created based on valid data and will contain reliable results.
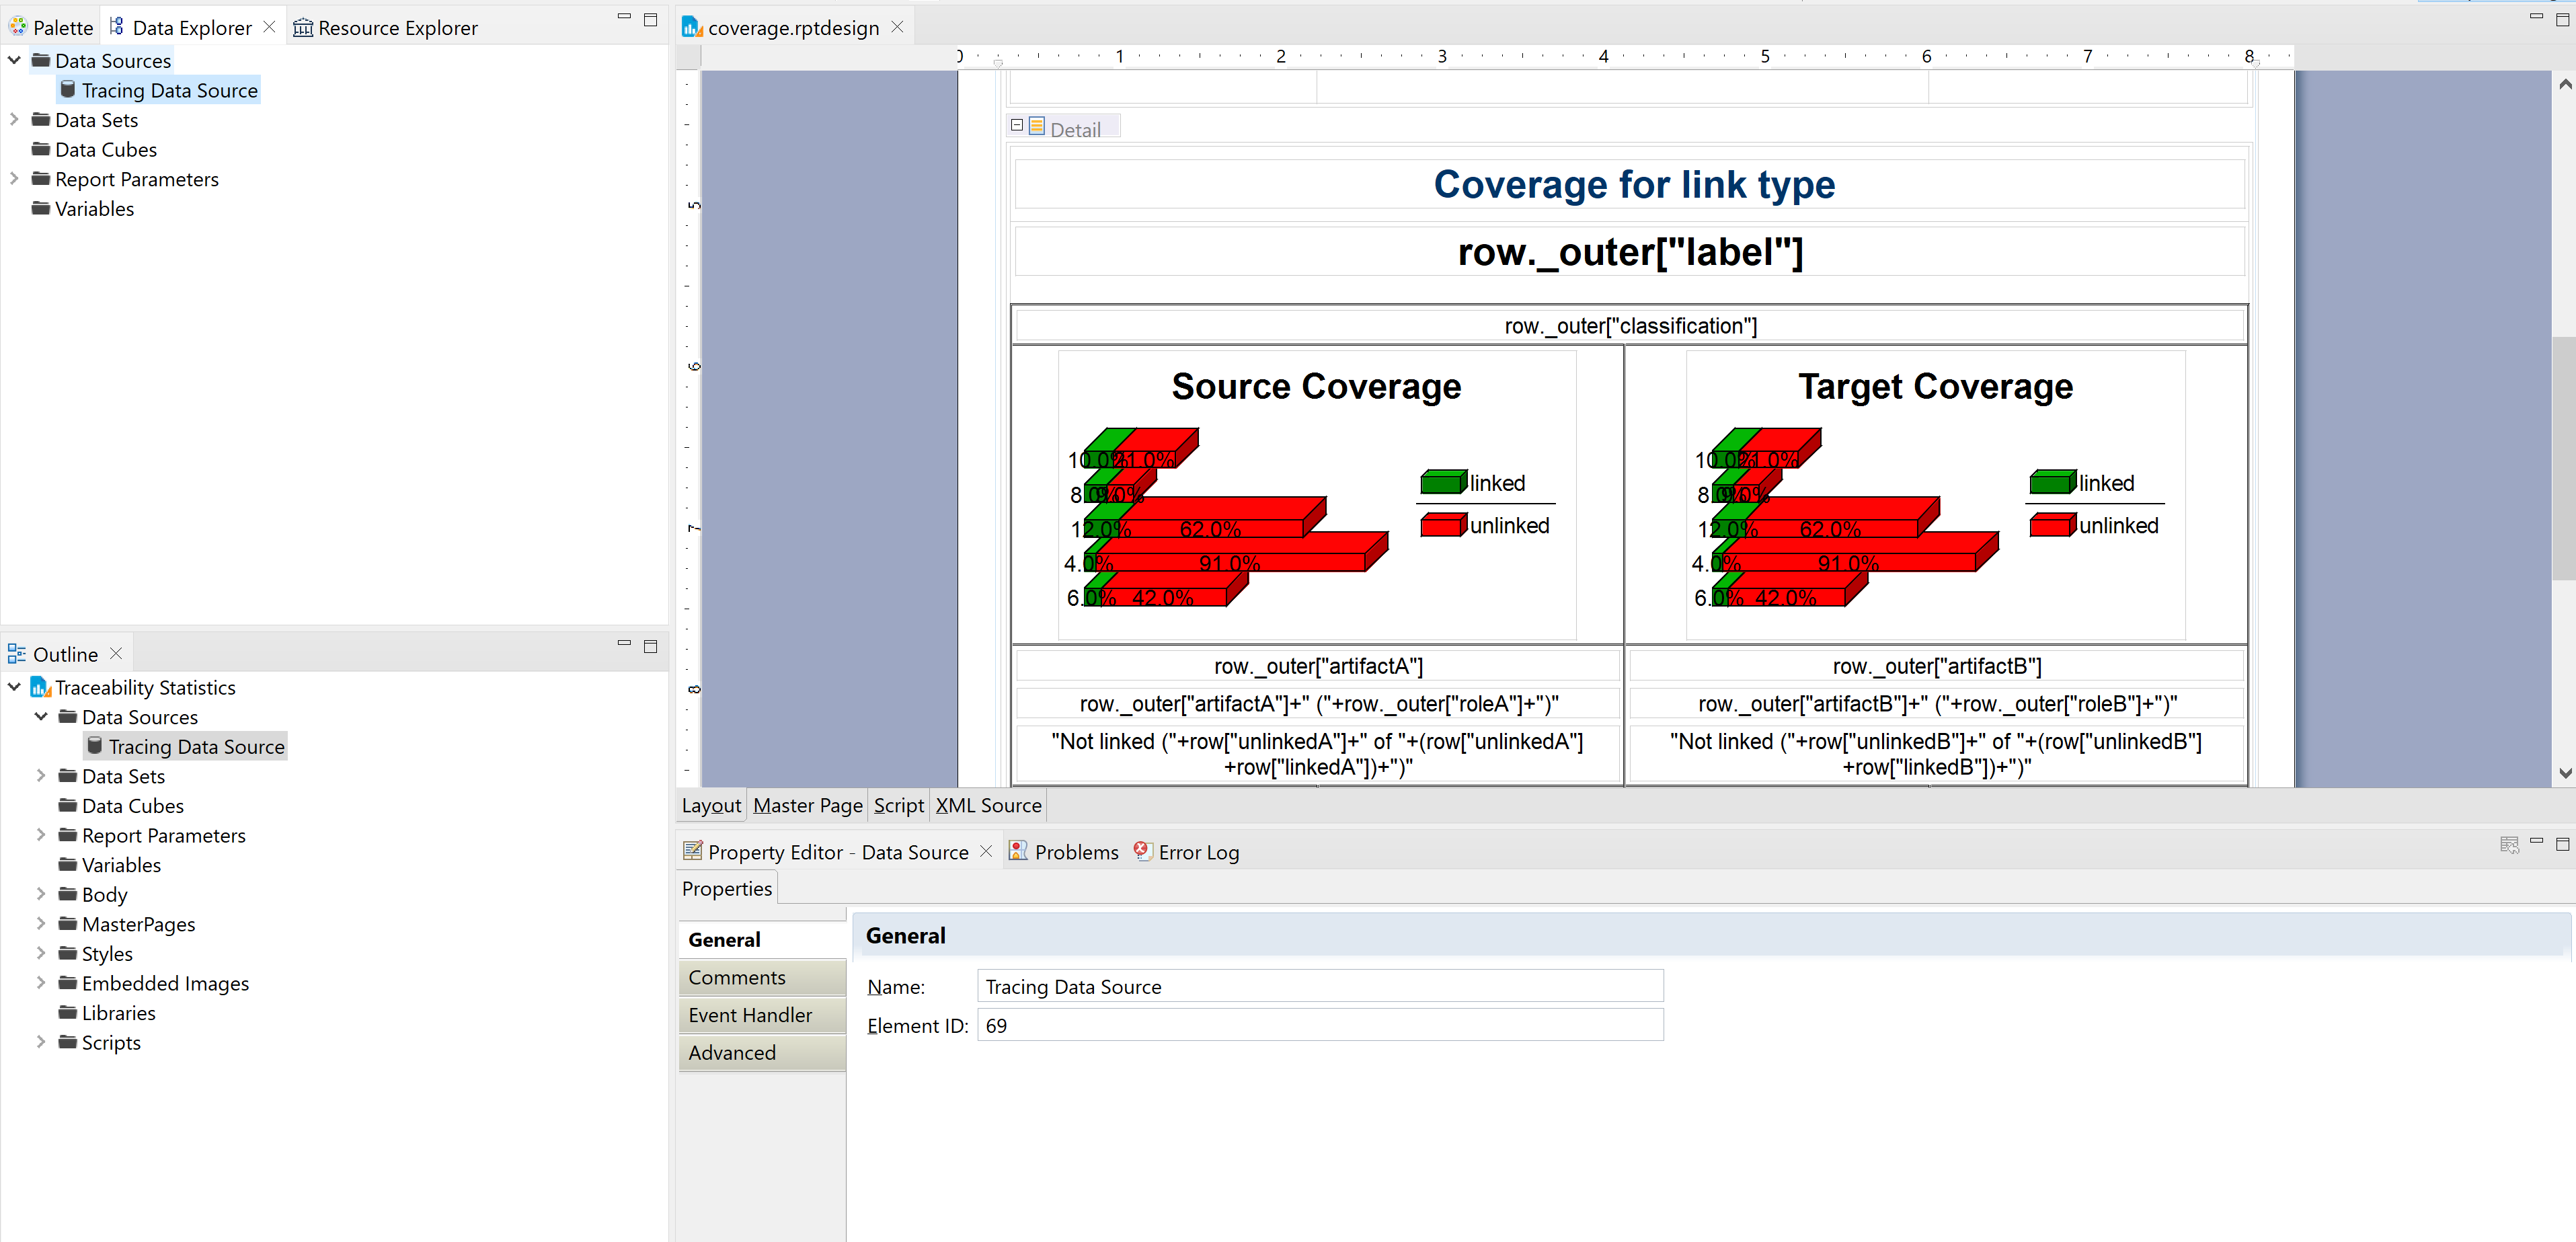
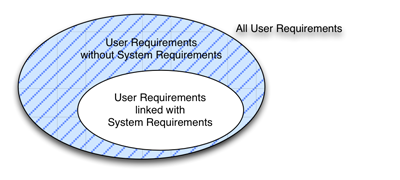
In the above example a coverage report is designed that shows User Requirements without System Requirements. Coverage analyzes are calculated by joining and filtering corresponding data sets.
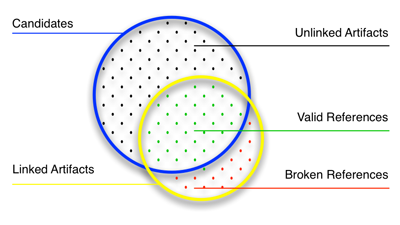
During the design of reports often all possible artifacts of a specific type are required. These sets are called candidates. The figure below depicts the meaning of candidates.
Graphical export
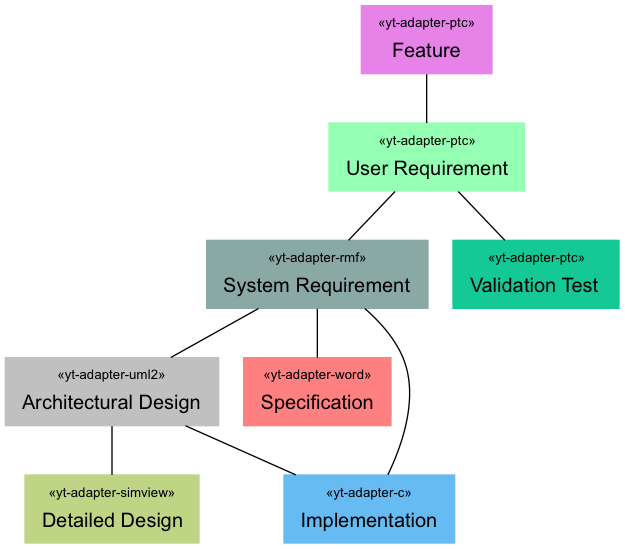
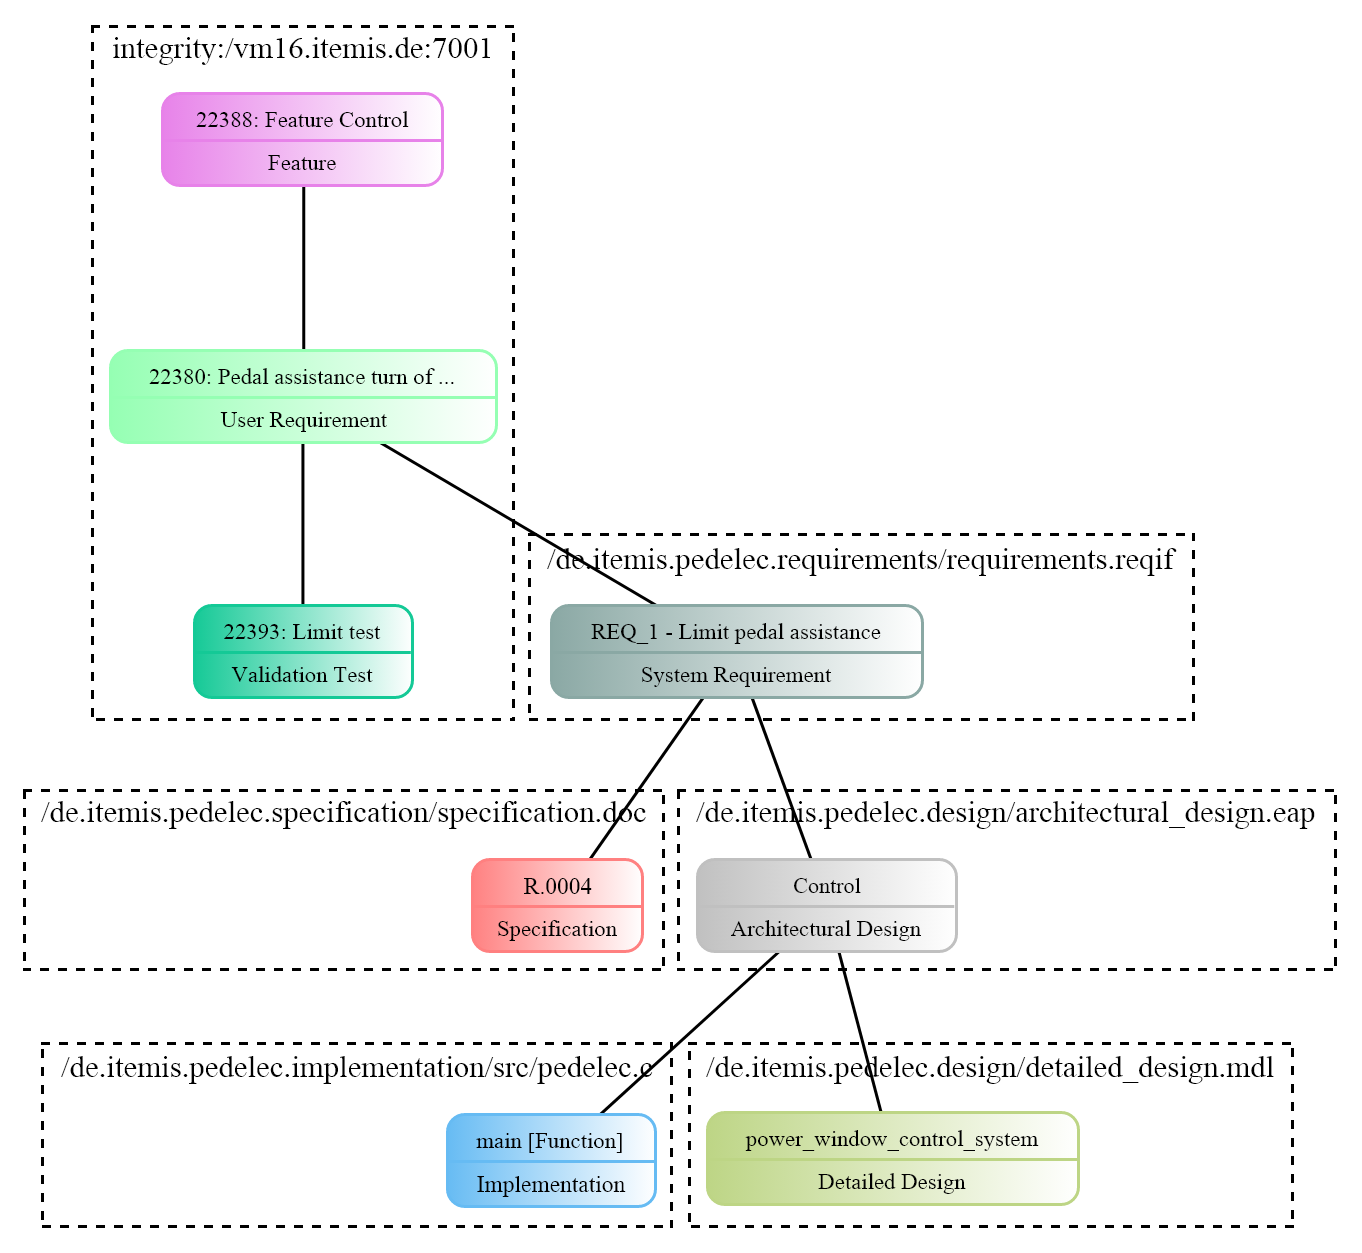
ANALYZE can export the configuration and the data as a graph. The export is a GraphViz dot-file that can be rendered with GraphViz. The files are generated by navigating to the menu entry
ANALYZE → Export → Export Configuration
or
ANALYZE → Export → Export Data
Below are sample exports of configuration and data.
GraphViz can be downloaded from http://www.graphviz.org/.