Browsing existing artifacts and links
Changing a requirement may have grave consequences on artifacts depending on it. itemis ANALYZE can help you visualize the extent of such impacts.
ANALYZE Explorer
The ANALYZE Explorer view can be used to navigate over traces and artifacts in a tree view. It also provides access to several traceability functions, like filtering and reporting over its menu. Expanding the tree shows the artifacts related to the traces. The tree is pruned in order to avoid cycles. A double-click on an artifact shows that artifact in its origin editor. By default, ANALYZE Explorer displays only linked artifacts, but it can be configured to also display unlinked ones.
In the ANALYZE Explorer tree, you can select one or more artifacts. Selecting multiple artifacts is useful to populate the ANALYZE Editor or ANALYZE Favorites views quickly, or to delete multiple links at the same time.
If an element in the ANALYZE Explorer tree has a lot of children, the latter are grouped into chunks with separate nodes that can be opened and closed individually. By default, "a lot of children" means "thousand or more". You can configure that number in the preferences under Layout and Views, i.e., select Window → Preferences in the main menu, then open itemis ANALYZE → Layout and Views.
For performances reasons, the Select All action ([Ctrl]+A) will not select the entire tree if the number of expanded elements is too high. The exact behavior of this action is undetermined in this case. The only guarantee is that this action will select all items currently visible (on screen), plus a few more. The same goes for multi-selection via [Shift]+click or [Ctrl]+click, which might not select the entire range of elements if there are too many elements.
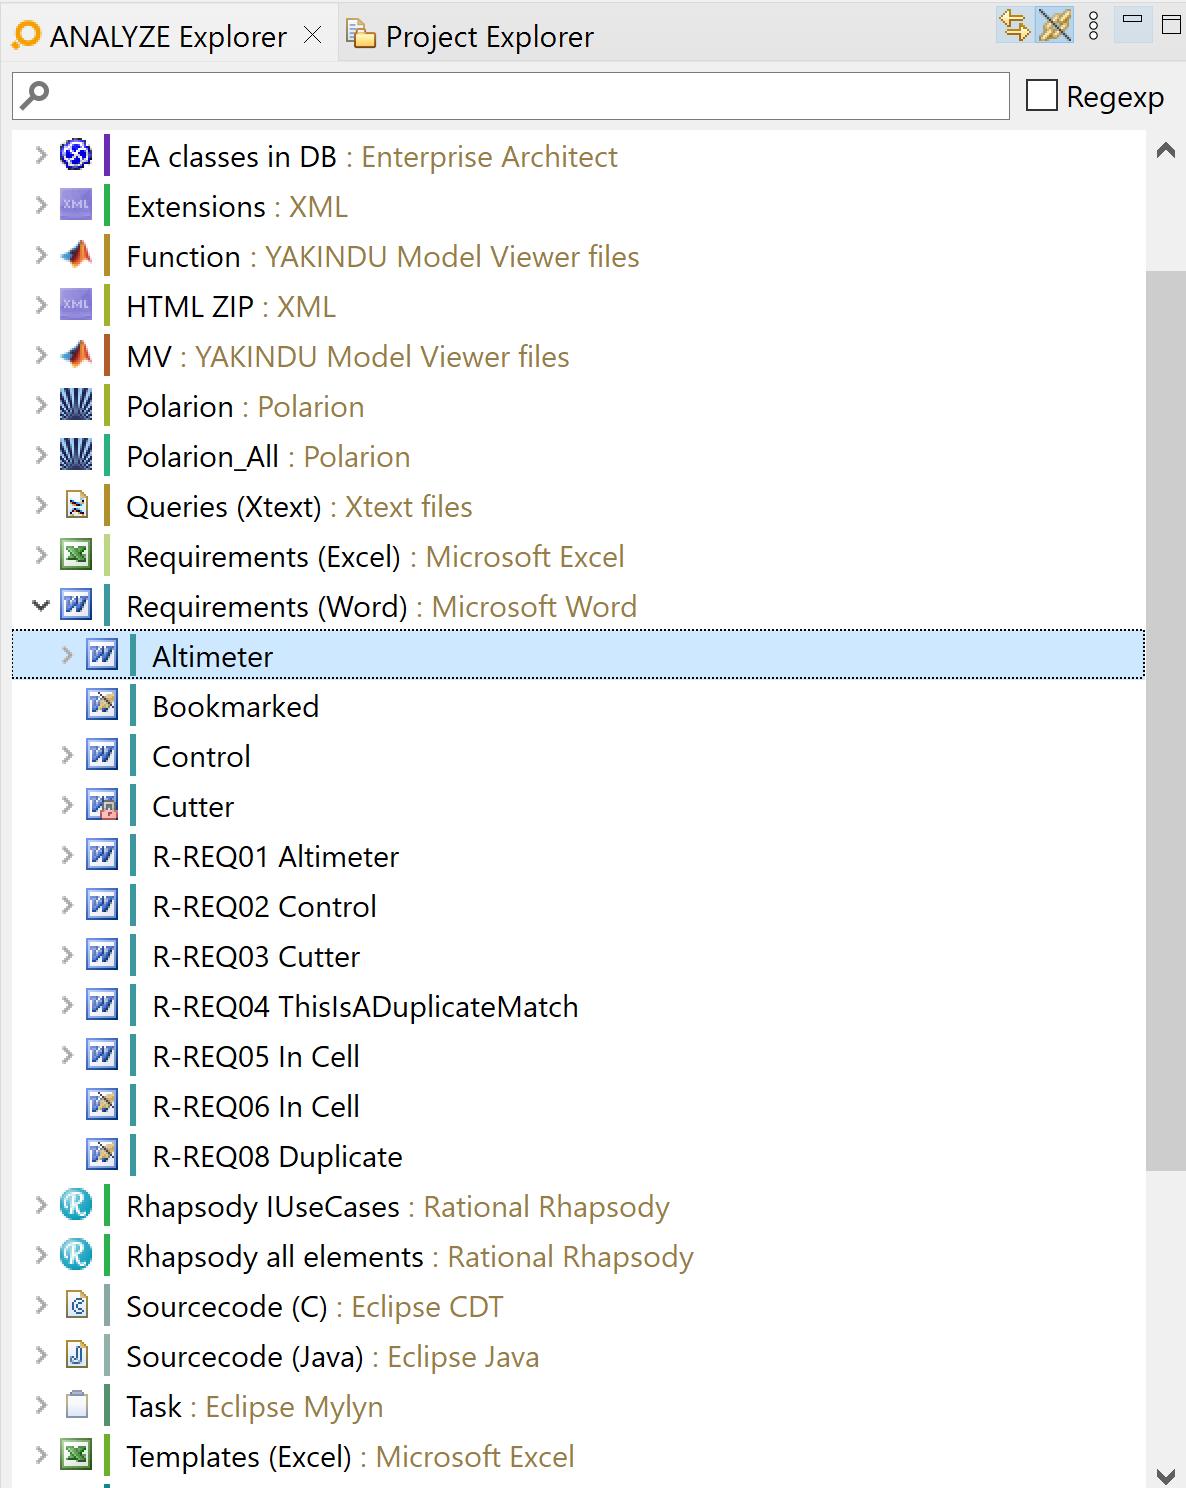
Show links based on different groupings
The menu provides access to several grouping modes.
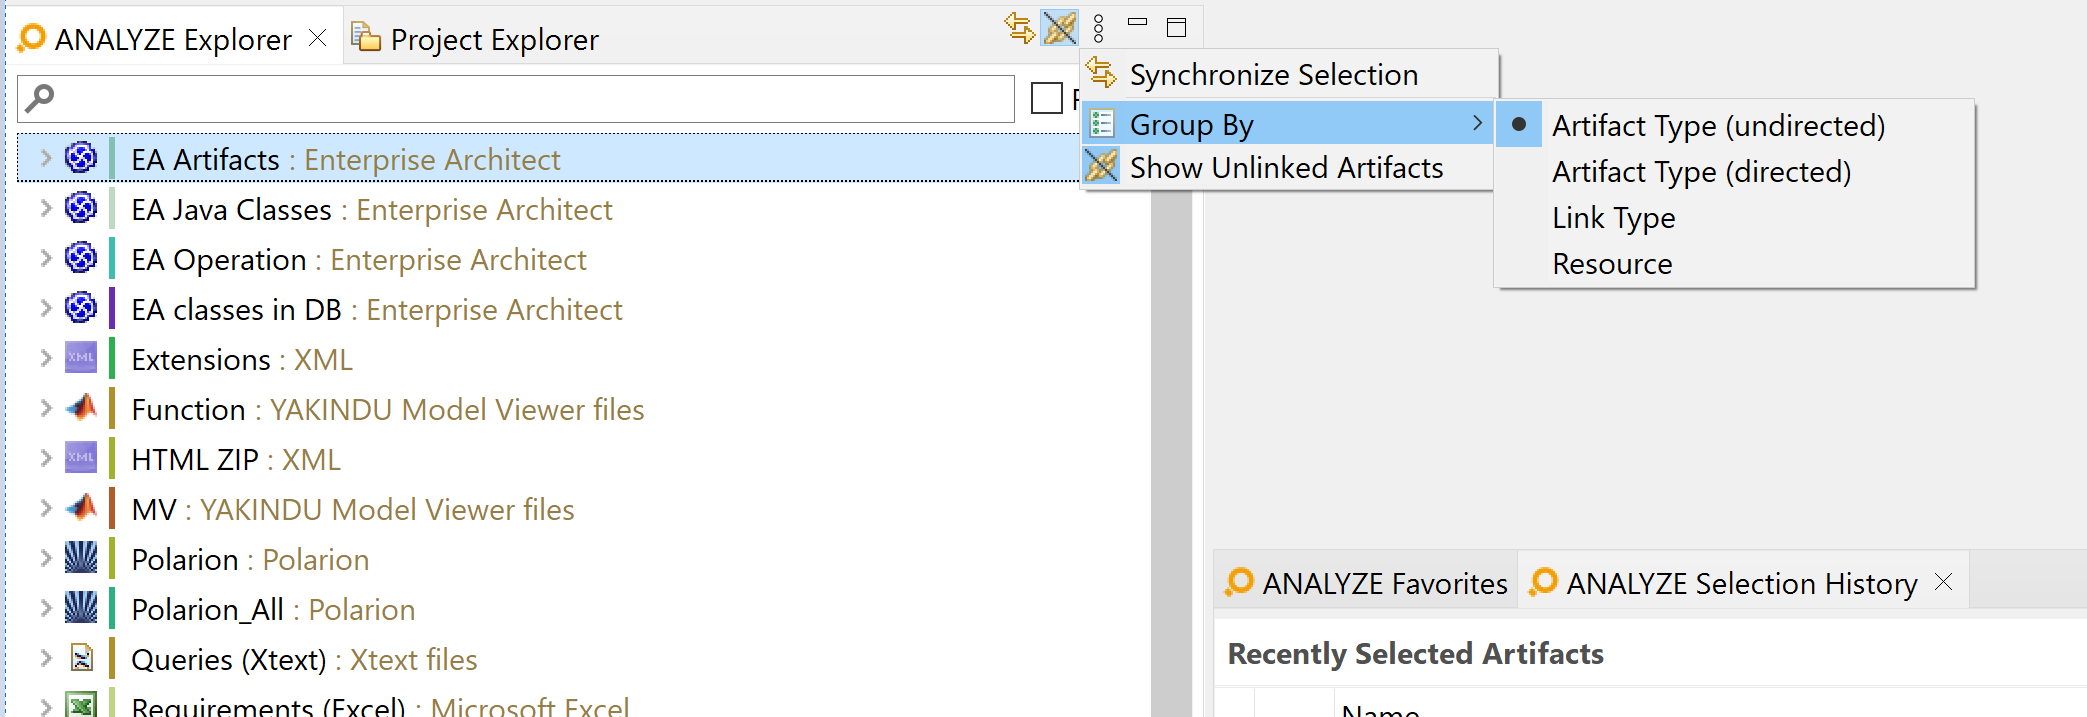
- Artifact type (undirected), default: Displays traces grouped by artifact types without regarding the link direction.
- Artifact type (directed): Displays traces grouped by artifact types, taking the direction into account (from A to B). Each artifact that is linked as A can be expanded to show the artifacts that are linked to it as B.
- Link type: Displays traces grouped by link types.
- Resource: Displays traces grouped by resources.
By default, the ANALYZE Explorer shows only linked artifacts (i.e., artifacts with at least one incoming or outgoing link), regardless of the chosen grouping. By activating the toggle "Show Unlinked Artifacts" in the menu (or by pressing the corresponding tool bar icon), you can display also unlinked artifacts (i.e., artifacts without any incoming or outgoing link). Note that this can incur a significant performance penalty when there are many unlinked artifacts. Unlinked artifacts are marked with the same symbol that is used for the "Show Unlinked" toggle. For the grouping mode "Link type", no unlinked artifacts are shown independent of the toggle state.
Filter the displayed links
The ANALYZE Explorer provides two means to filter the content:
- A fast textual filter that considers artifact names only
- Means to configure and save filter configurations which consider attributes of the link type and the artifact type as they are defined in the ANALYZE Configuration, e.g., link types, artifact types etc.
Textual filters
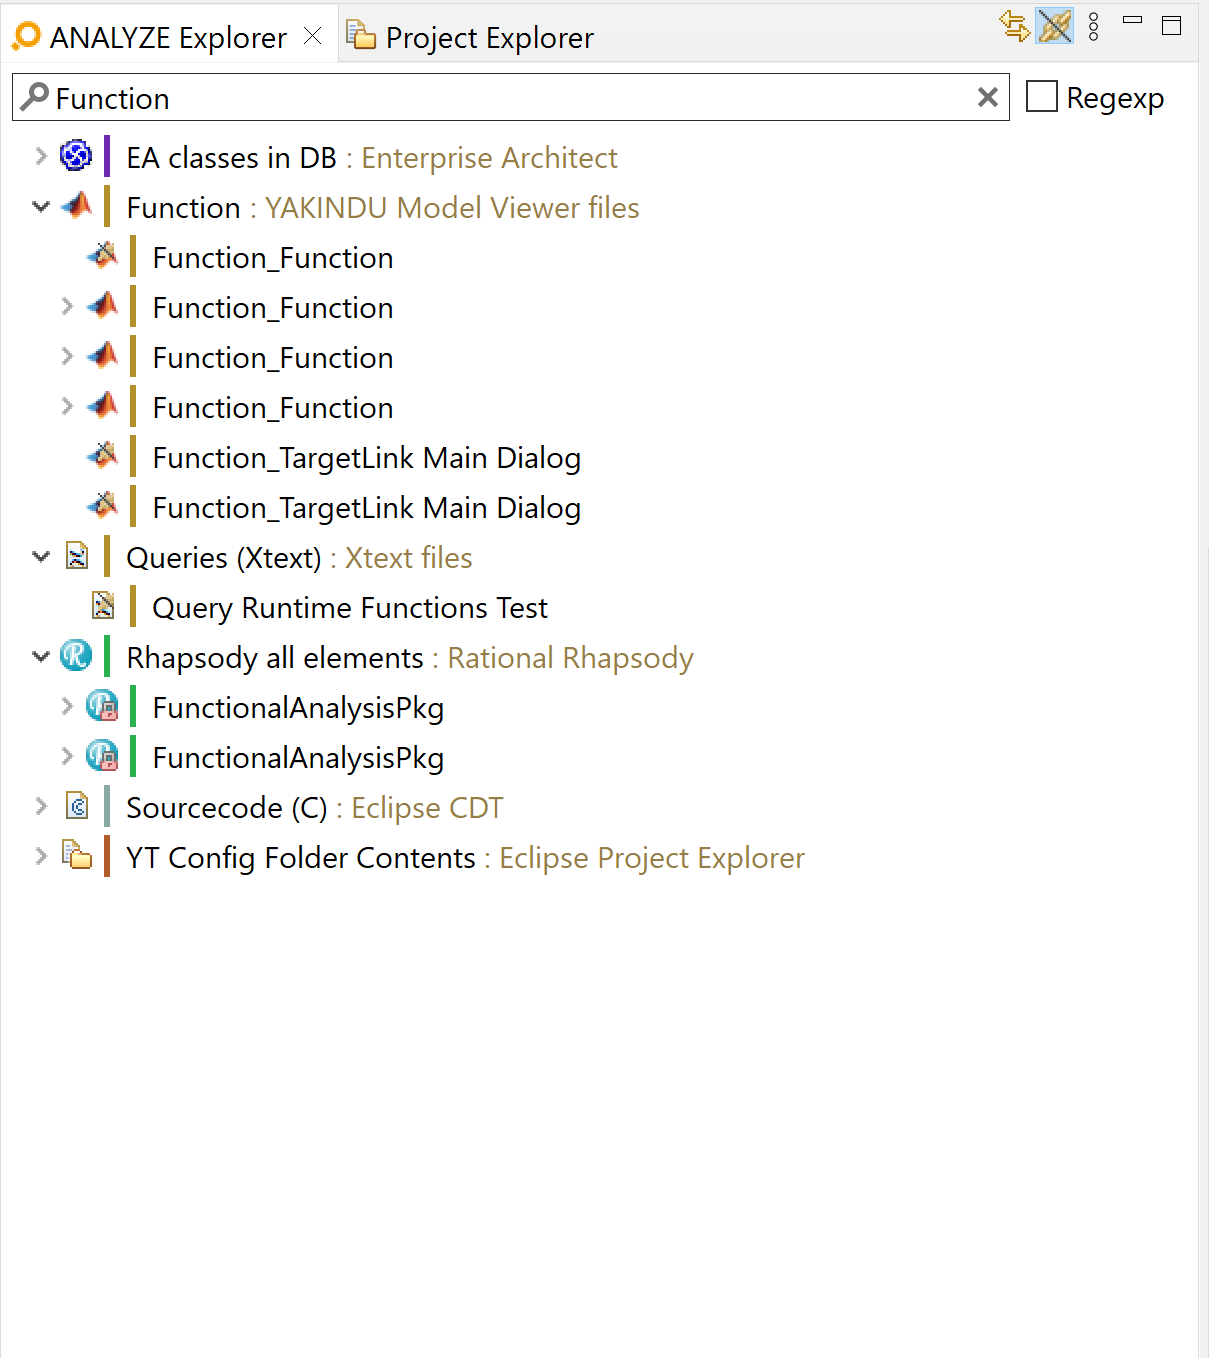
Textual filters can be defined in the text field at the top of the ANALYZE Explorer. If a textual filter is set, the Explorer shows only artifacts (and the belonging links) with a name that conforms to that filter. Note that you need to hit enter in order to confirm your filter. Entering a blank (empty) text or a click on the rubber icon clears the filter.
The Regexp checkbox controls whether the entered text works as a plain text filter or as a regular expression:
- A plain text filter matches if the name of an artifact contains the given text. It is not case-sensitive.
- A regexp filter matches if the identifier matches the given expression.
Synchronize selection
The ANALYZE Explorer can be put into synchronize selection mode. If the mode is activated, the ANALYZE Explorer will listen for selection events and if a artifact is selected that has trace links, only the related artifacts will be displayed. This mode can be activated by clicking  in the toolbar or by selecting Synchronize Selections in the menu.
Label Decorations
ANALYZE visualizes different states of artifacts via so-called label decorations. These decorations can be enabled or disabled under Window → Preferences → General → Appearance → Label Decorations. The label decorations specific to itemis ANALYZE are on the bottom of the list. These are the following label decorations to enable or disable:
- ANALYZE Artifact Issue Decorator
- ANALYZE Artifact Locked Decorator
- ANALYZE Artifact Type Decorator
- ANALYZE Artifact Unlinked Decorator
- ANALYZE Artifact Adapter Decorator
- ANALYZE Children numbers
- ANALYZE Link Issue Decorator
- ANALYZE Link Locked Decorator
- ANALYZE Link Relation Decorator
- ANALYZE Link Type Issue Decorator
- ANALYZE Self-Linked Artifact Decorator
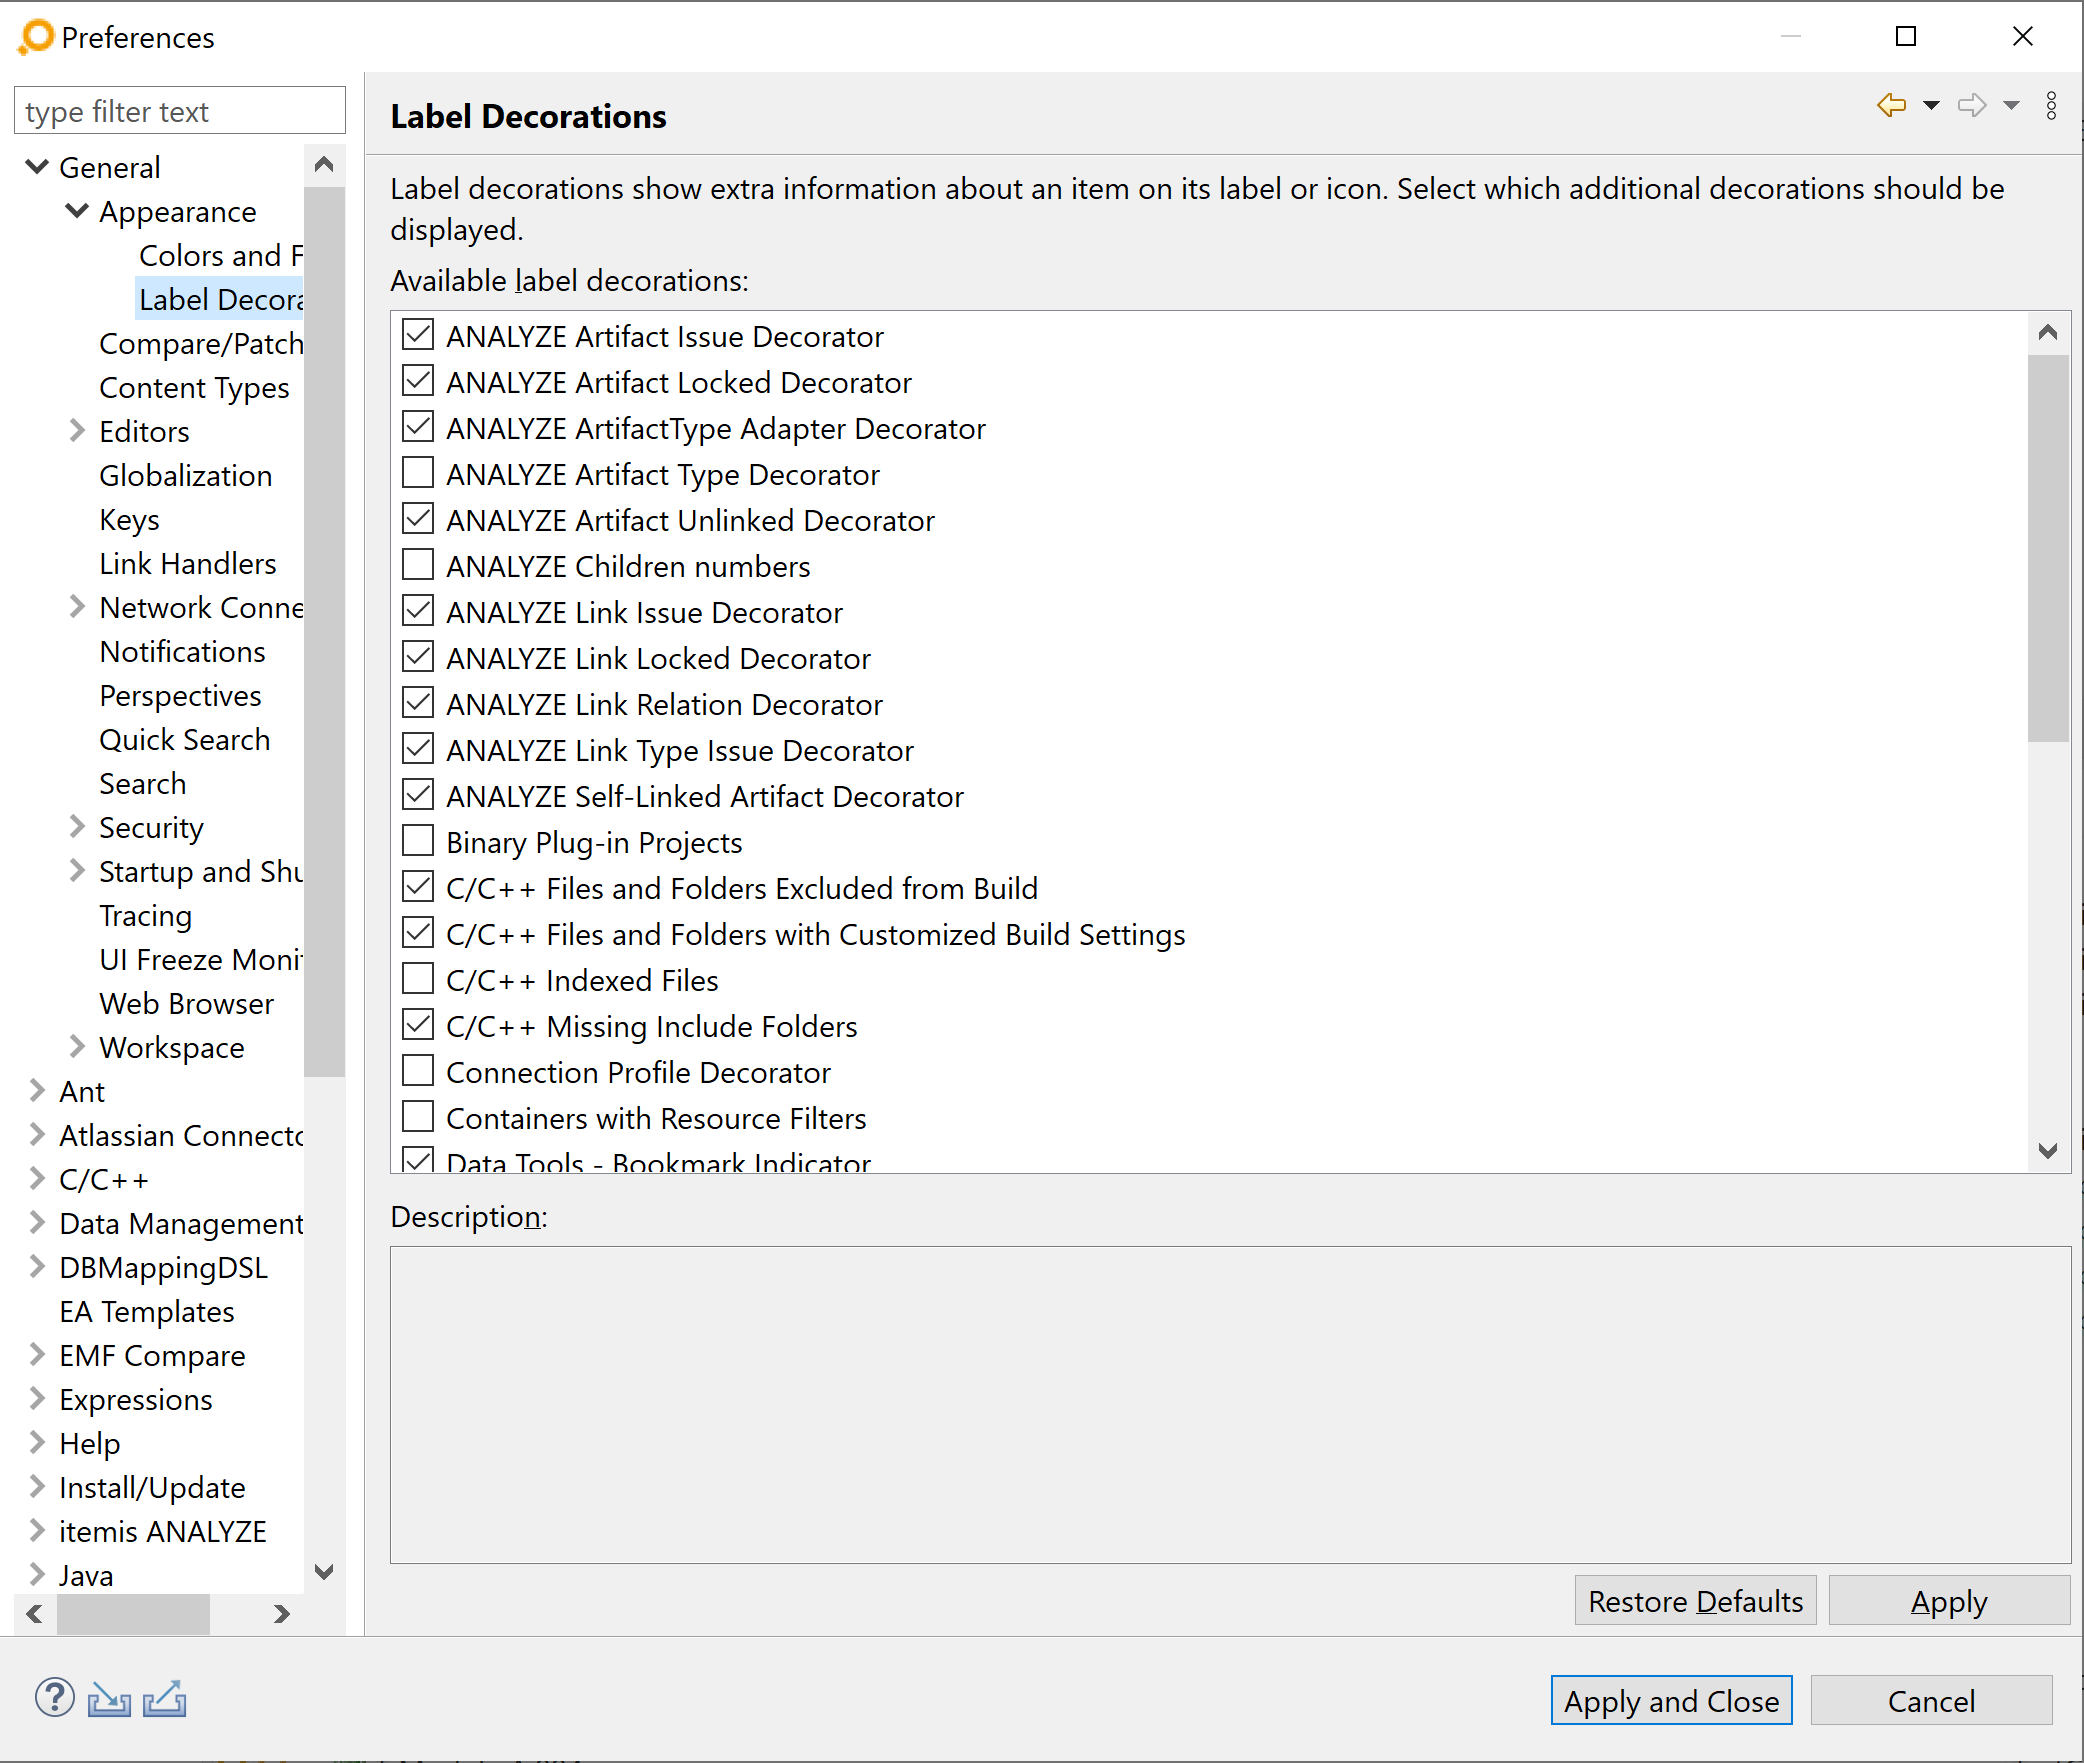
The image shows the default settings for the itemis-ANALYZE-specific label decorations. The ANALYZE Artifact Type Decorator and the ANALYZE Children numbers decorator are disabled by default, all others are enabled. Some of the decoration labels are only visible in the ANALYZE Explorer, others only in the ANALYZE Overview and some are visible in both views.
The following sections will go into detail for each label decoration. Each section includes an image that shows example artifacts with the corresponding label decoration. All other label decorations are disabled in the preferences.
ANALYZE Artifact Issue Decorator
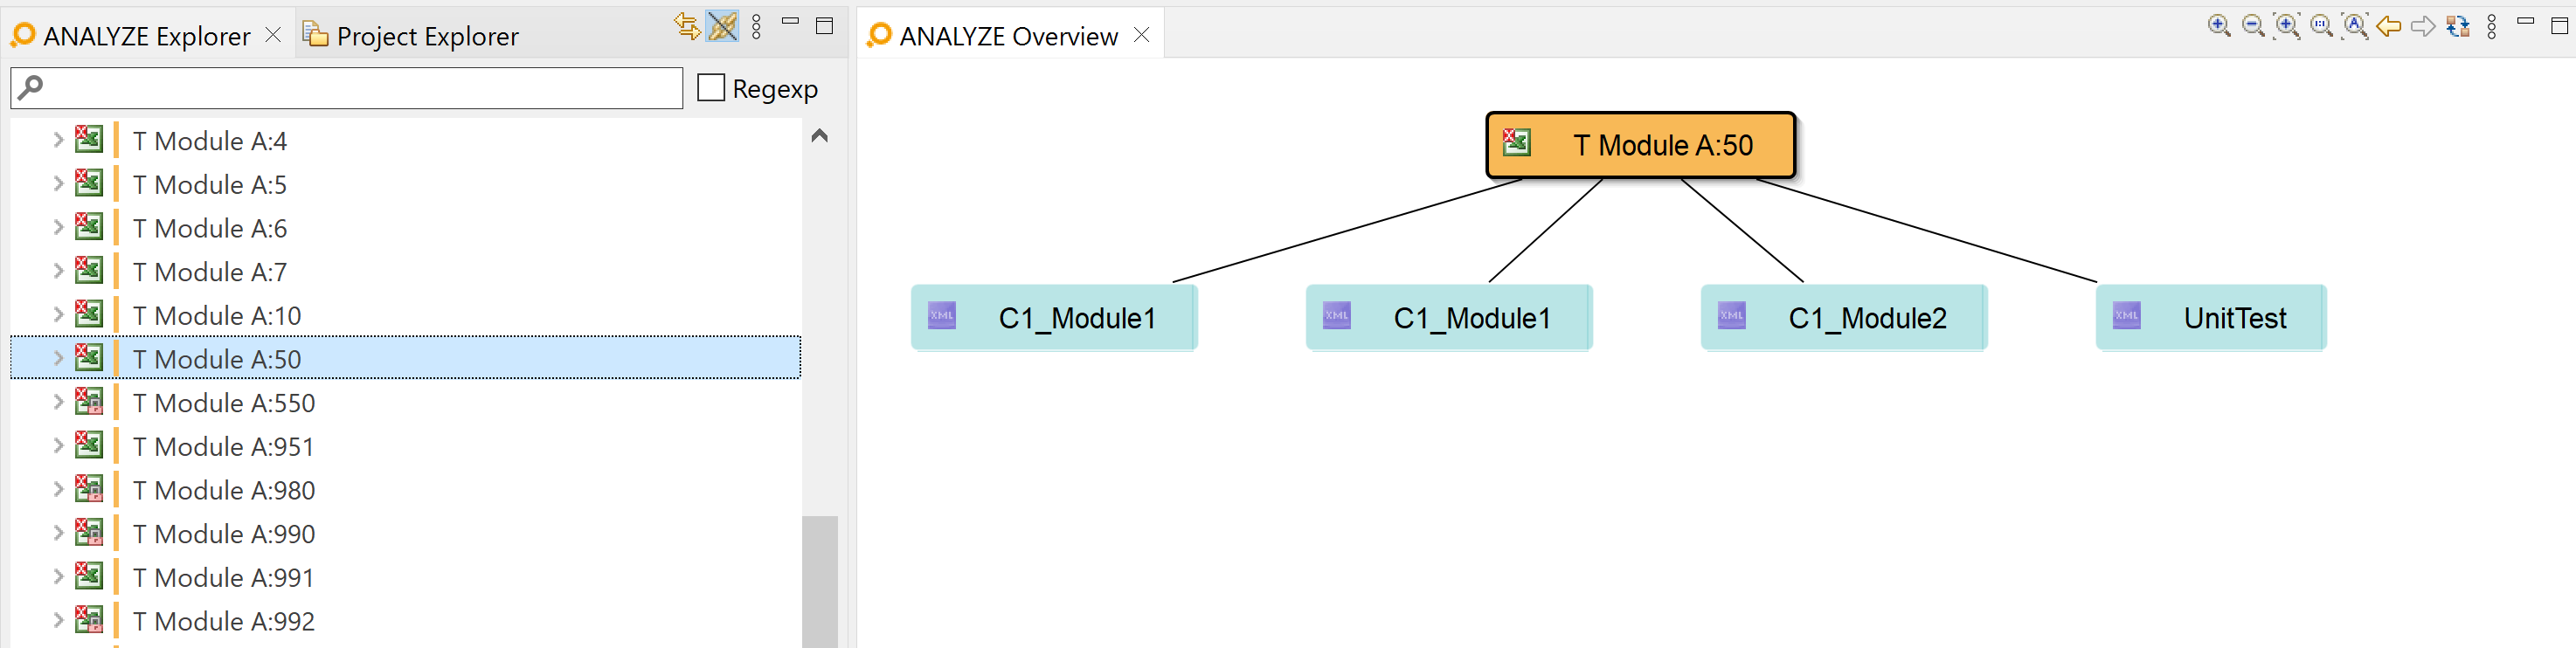
Artifacts can be labeled with three different issue types via the ANALYZE Artifact Issue Decorator. An issue can be labeled as information, warning or error. The decoration icon will be in the top left corner of the artifact icon. This decoration is shown both in the ANALYZE Explorer and in the ANALYZE Overview. The example below shows the error issue decoration for artifacts.
ANALYZE Artifact Locked Decorator
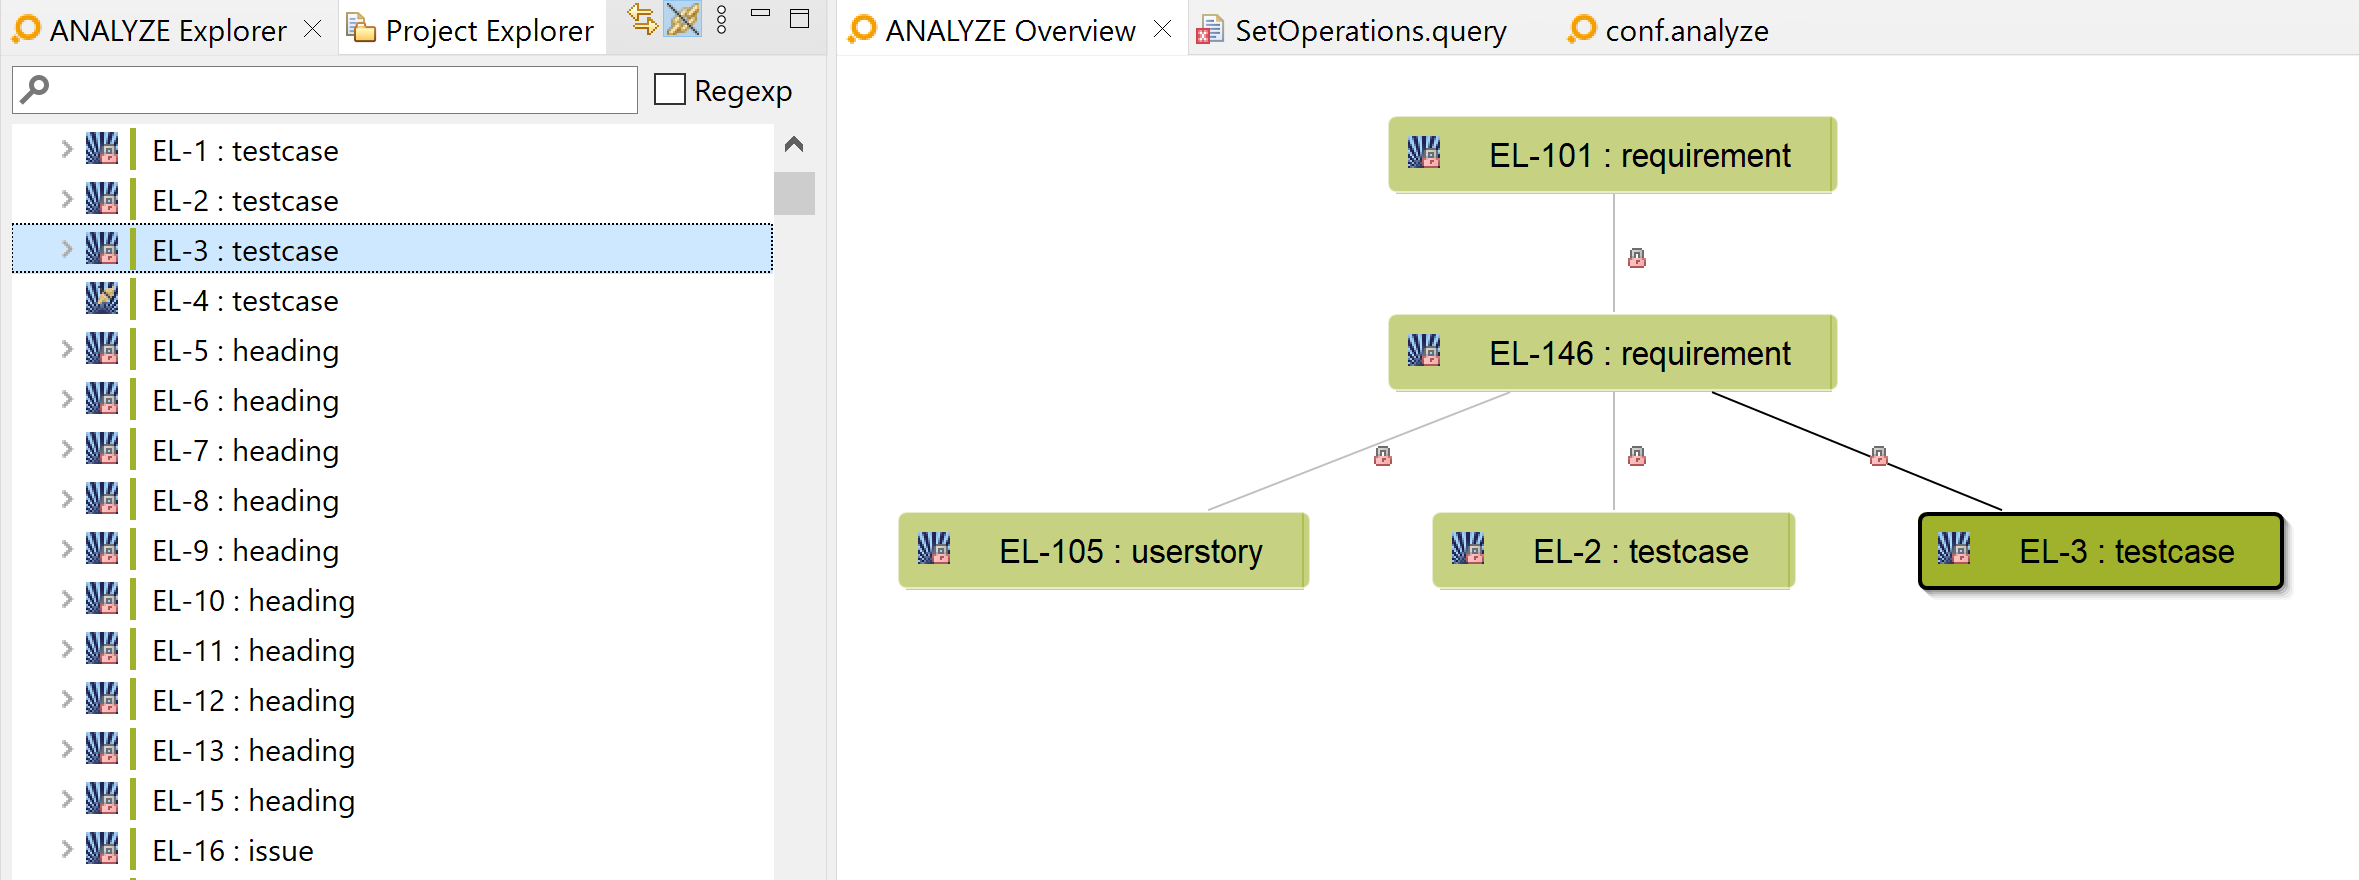
If it is not possible or not permitted to edit a particular artifact, it will be labeled on the bottom right of the artifact icon with a lock icon as shown in the image.
ANALYZE Artifact Type Decorator
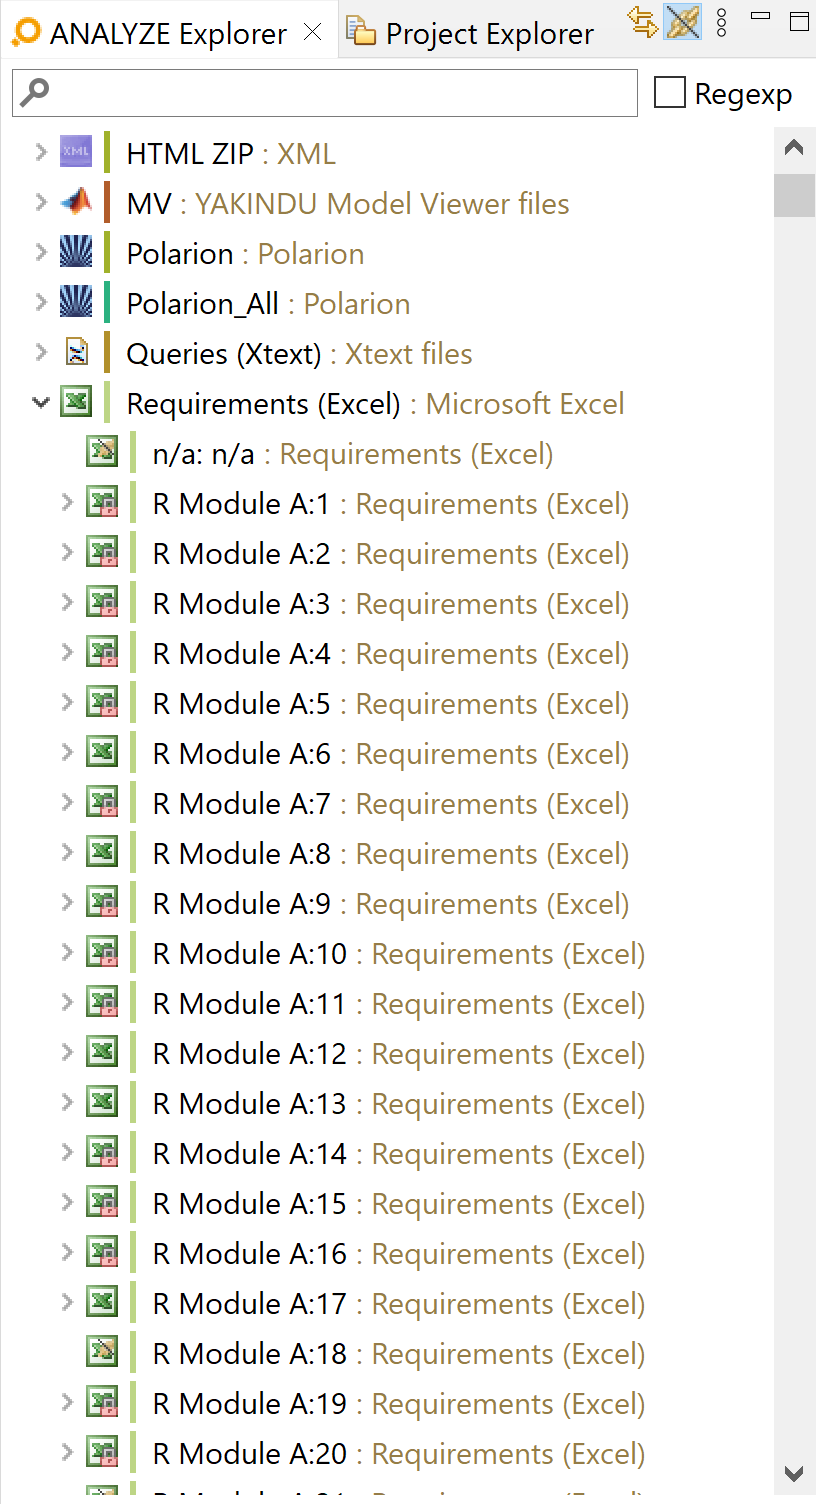
The ANALYZE Artifact Type Decorator writes the type of each Artifact as a suffix behind the name of the artifact, separated with a colon.
ANALYZE Artifact Unlinked Decorator
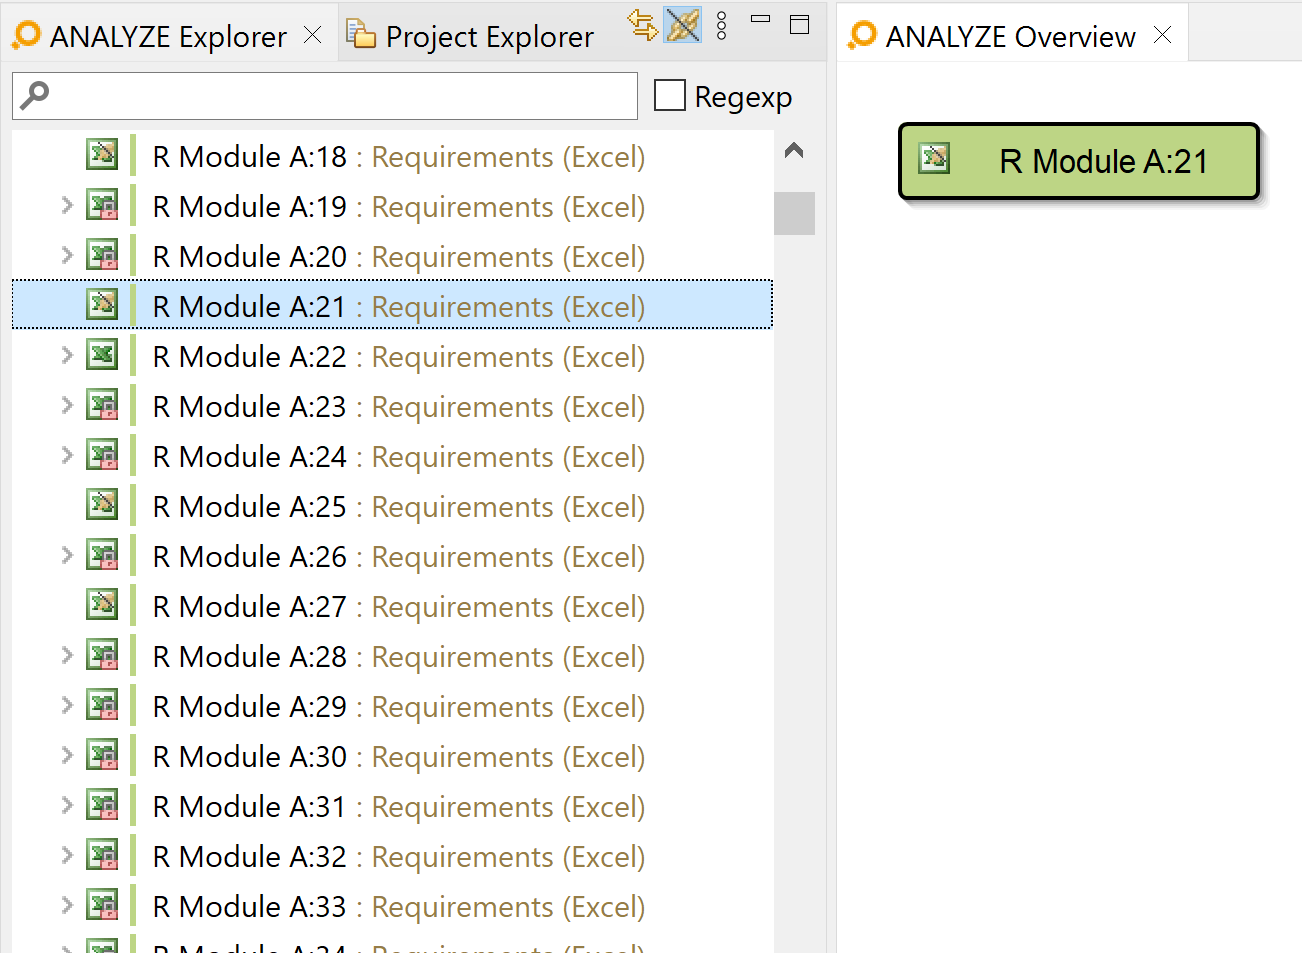
With the ANALYZE Artifact Unlinked Decorator enabled, a small icon will appear on the top right of the icon for each artifact which has no link to another artifact. This icon is visible in the ANALYZE Explorer and in the ANALYZE Overview, as shown in the picture below.
ANALYZE Artifact Adapter Decorator
The ANALYZE Artifact Adapter Decorator decorates artifact types with the data access type as a suffix. Similar to the ANALYZE Artifact Type Decorator.
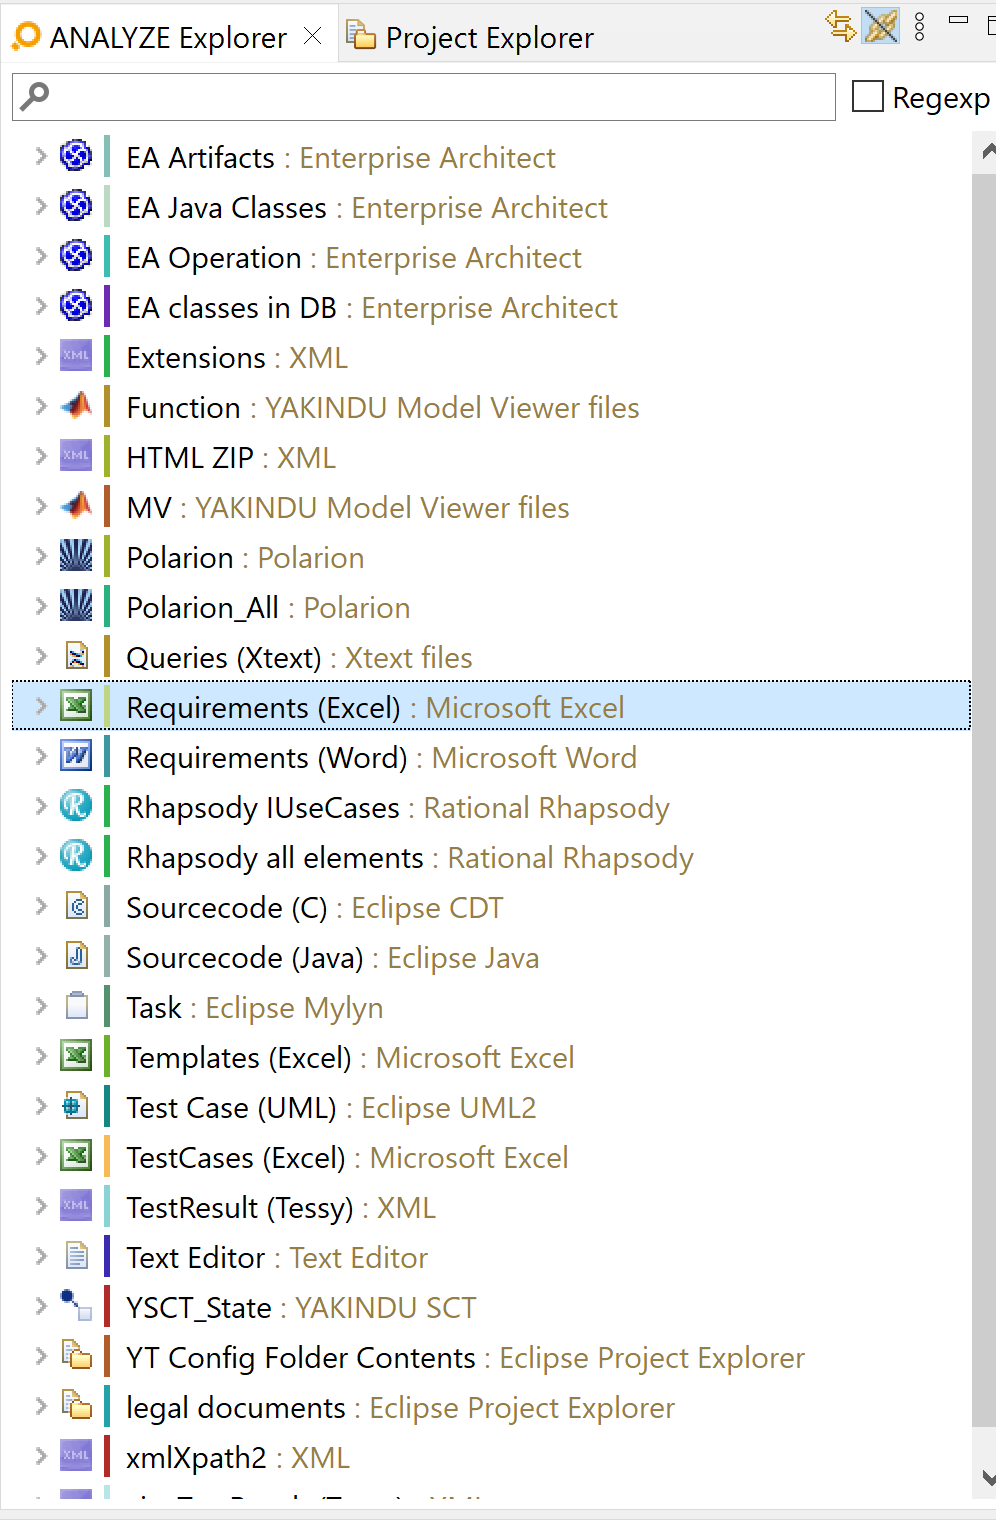
ANALYZE Children numbers
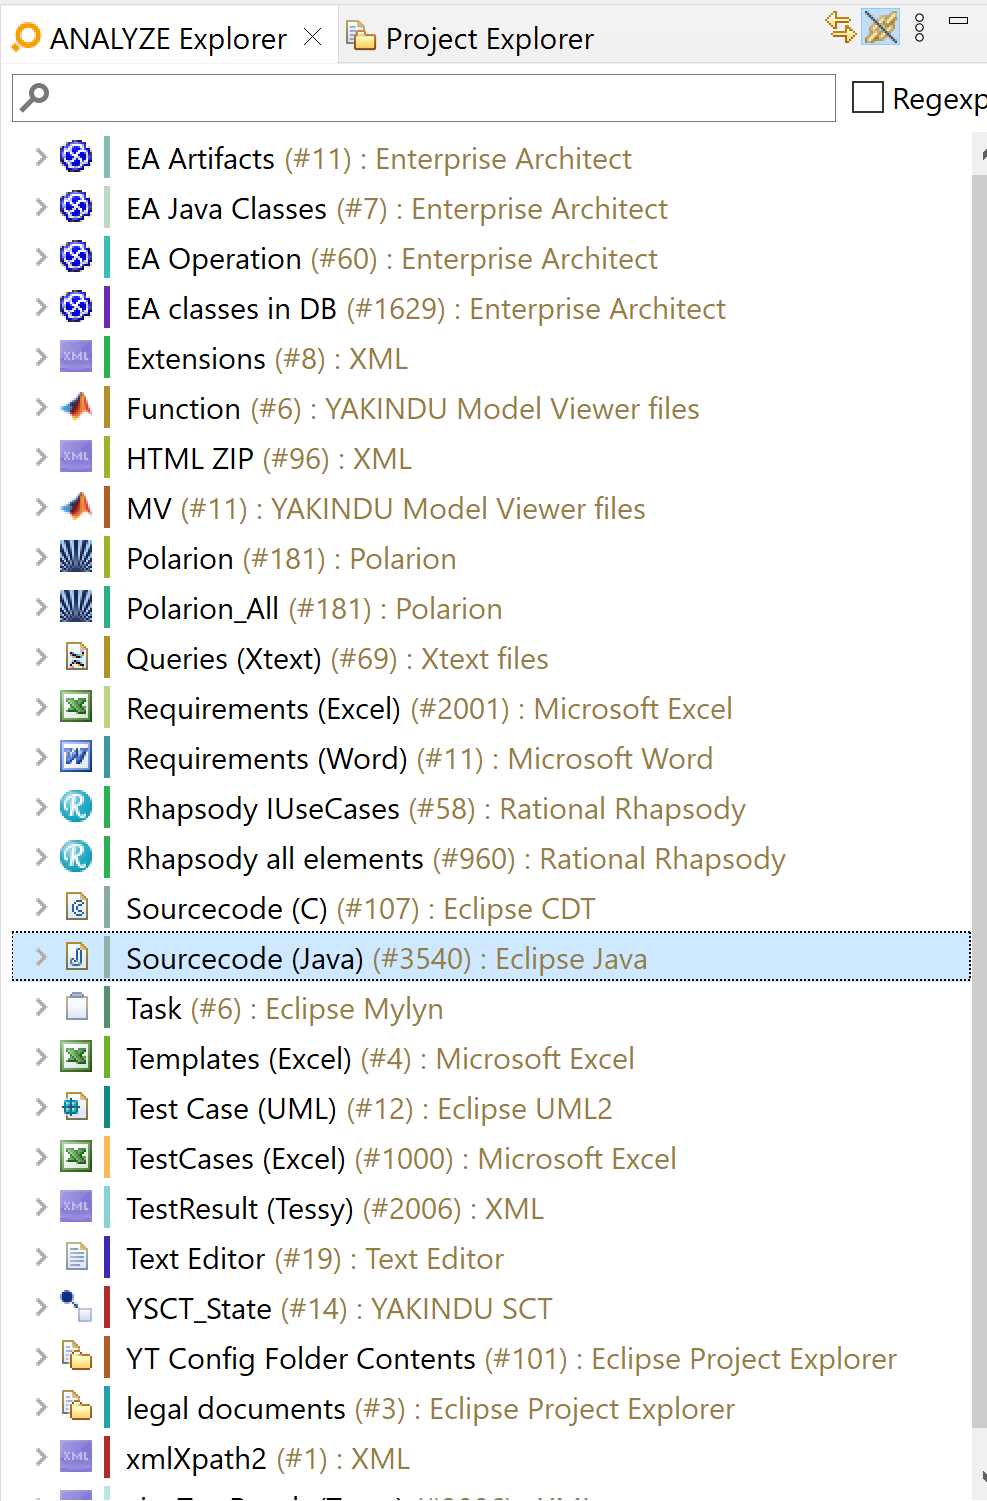
The ANALYZE Children numbers decorator is one of the two decorators which are not enabled per default. When it is enabled, it counts how many children a node has. It doesn't count the children of the children, it counts just on the first level. For example, in the picture below, the Requirements (Excel) Adapter has 12 children and the artifact R Module A:3 has 5 children.
ANALYZE Link Issue Decorator
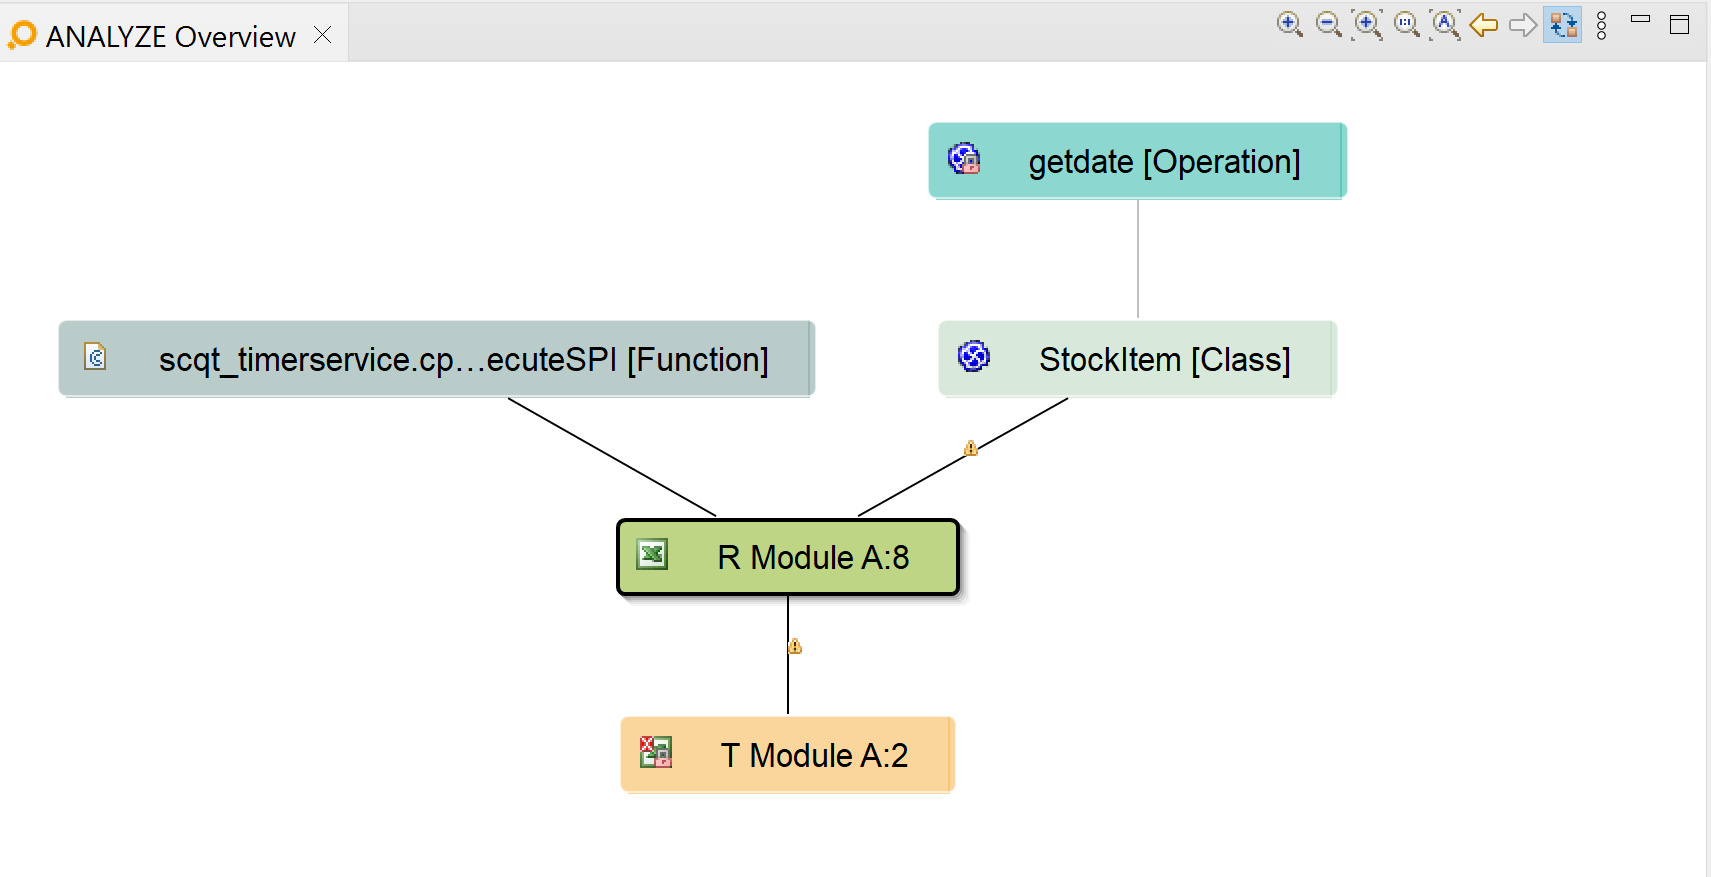
Similar to the ANALYZE Artifact Issue Decorator, a link can be labeled with three different icons: information, warning and error. This label is shown on the link between two artifacts in the ANALYZE Overview. In the example below, there is an warning icon on the link.
ANALYZE Link Locked Decorator
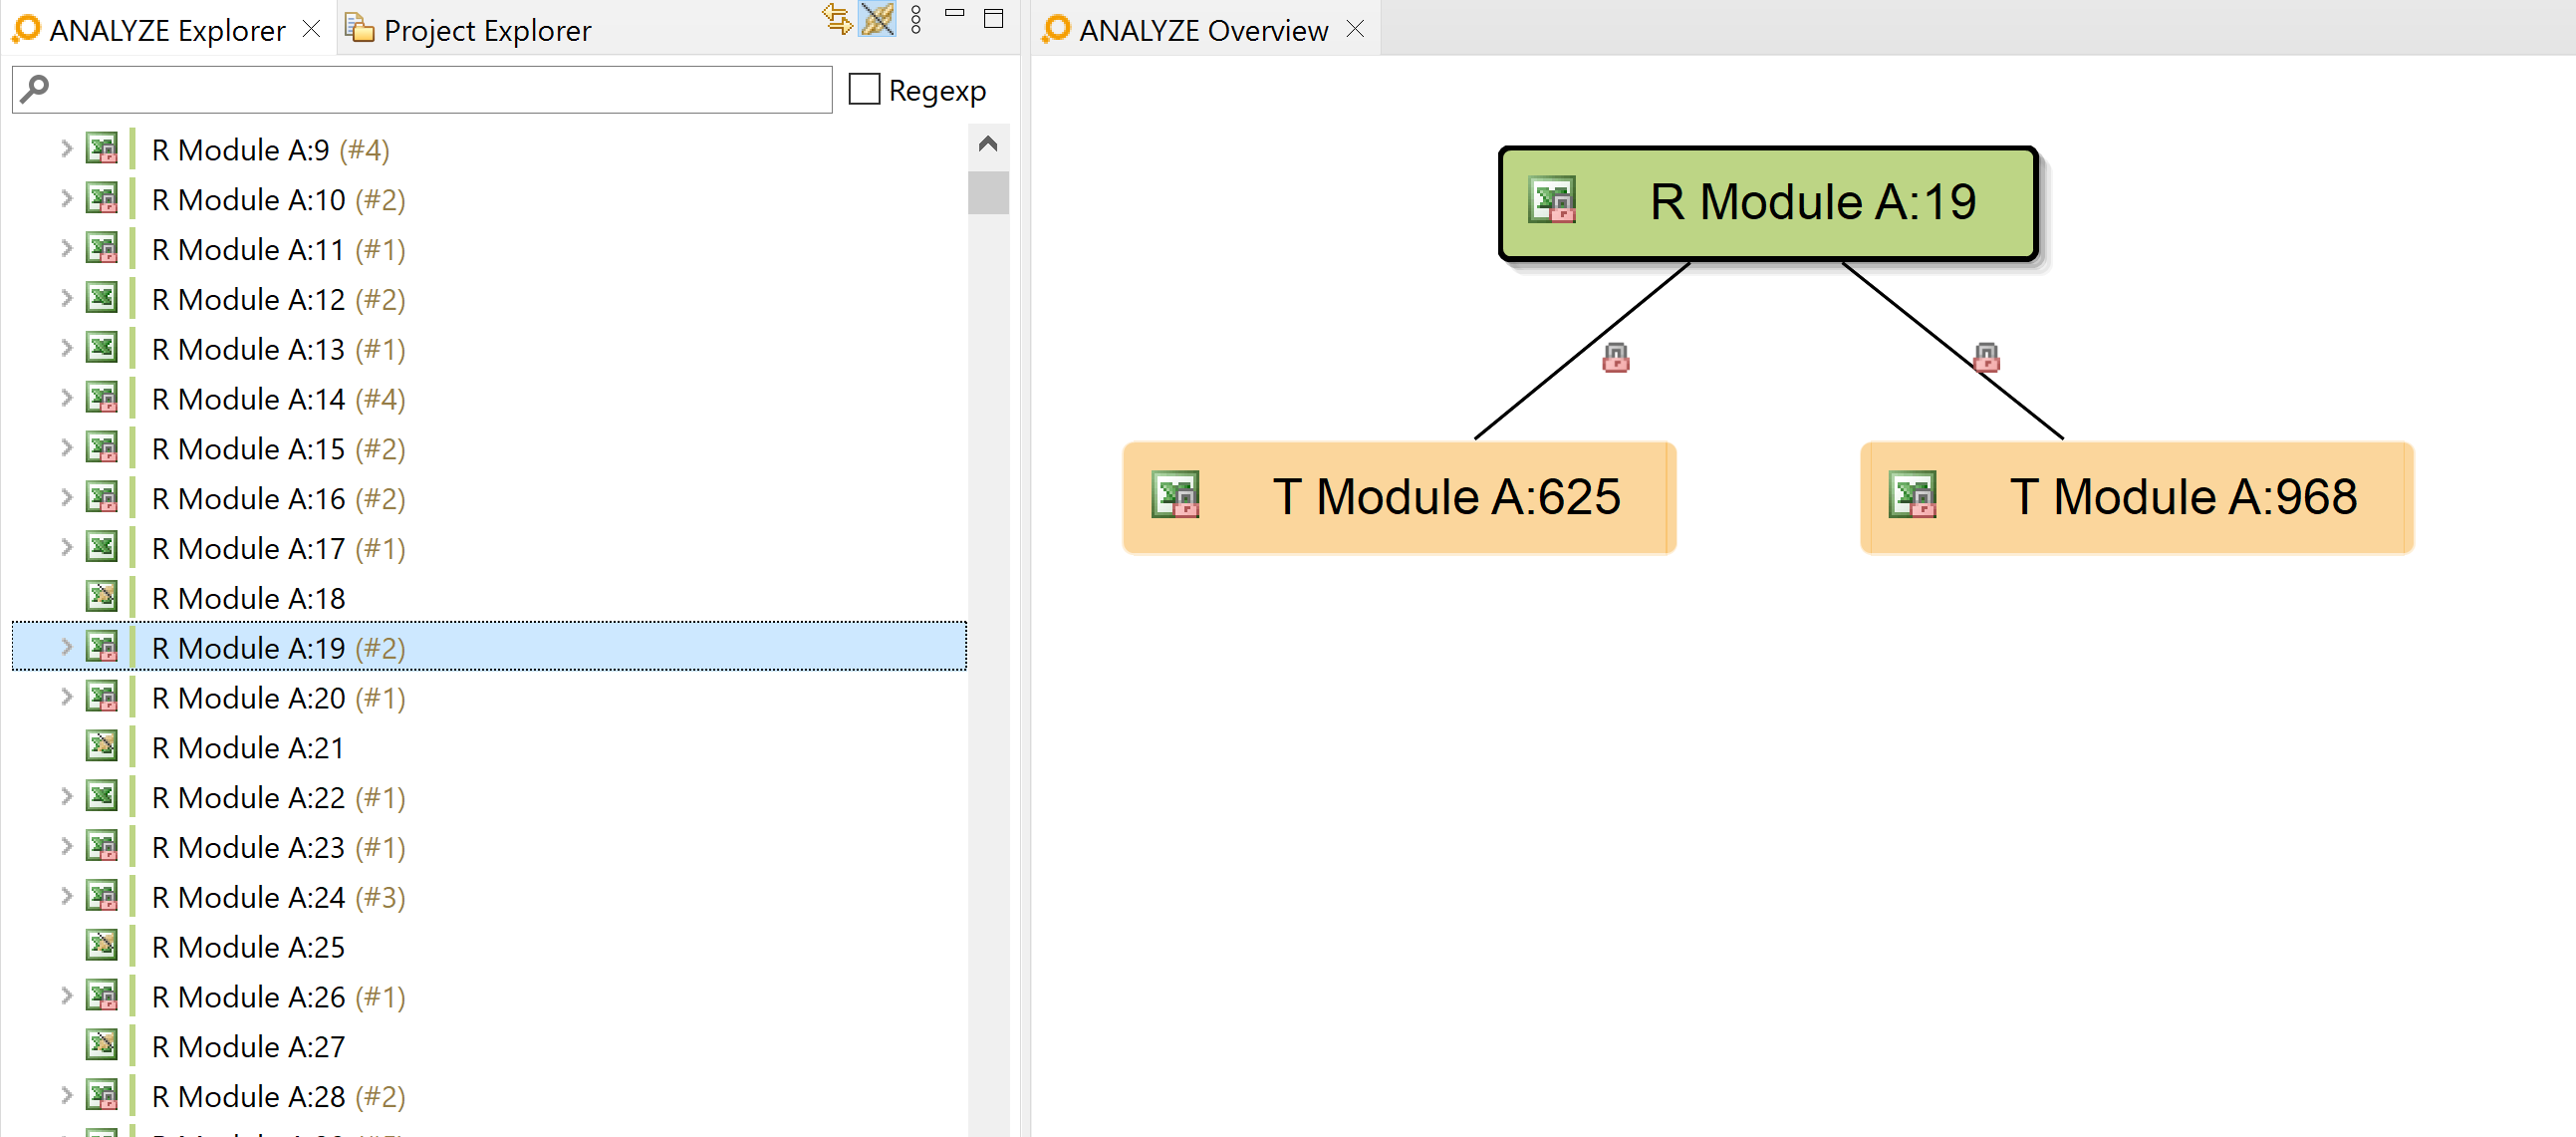
This decorator is only visible in the ANALYZE Overview and marks a link between two artifacts with a lock if this link is not editable.
ANALYZE Link Relation Decorator
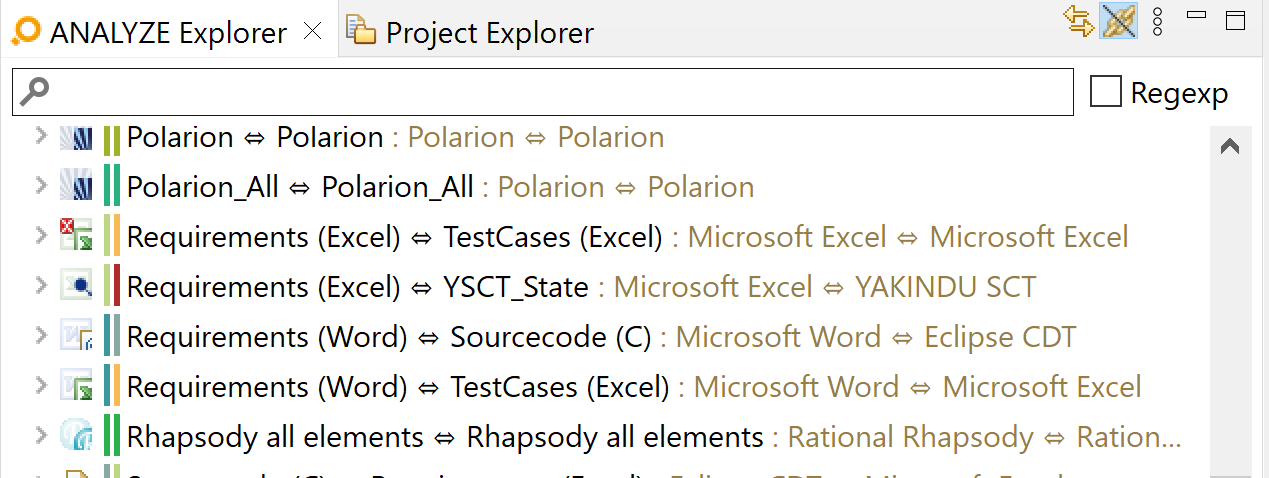
This decorator is visible in the ANALYZE Explorer if the Group By setting is set to Link Type. Then, the artifact types involved in each link type is shown behind the link type.
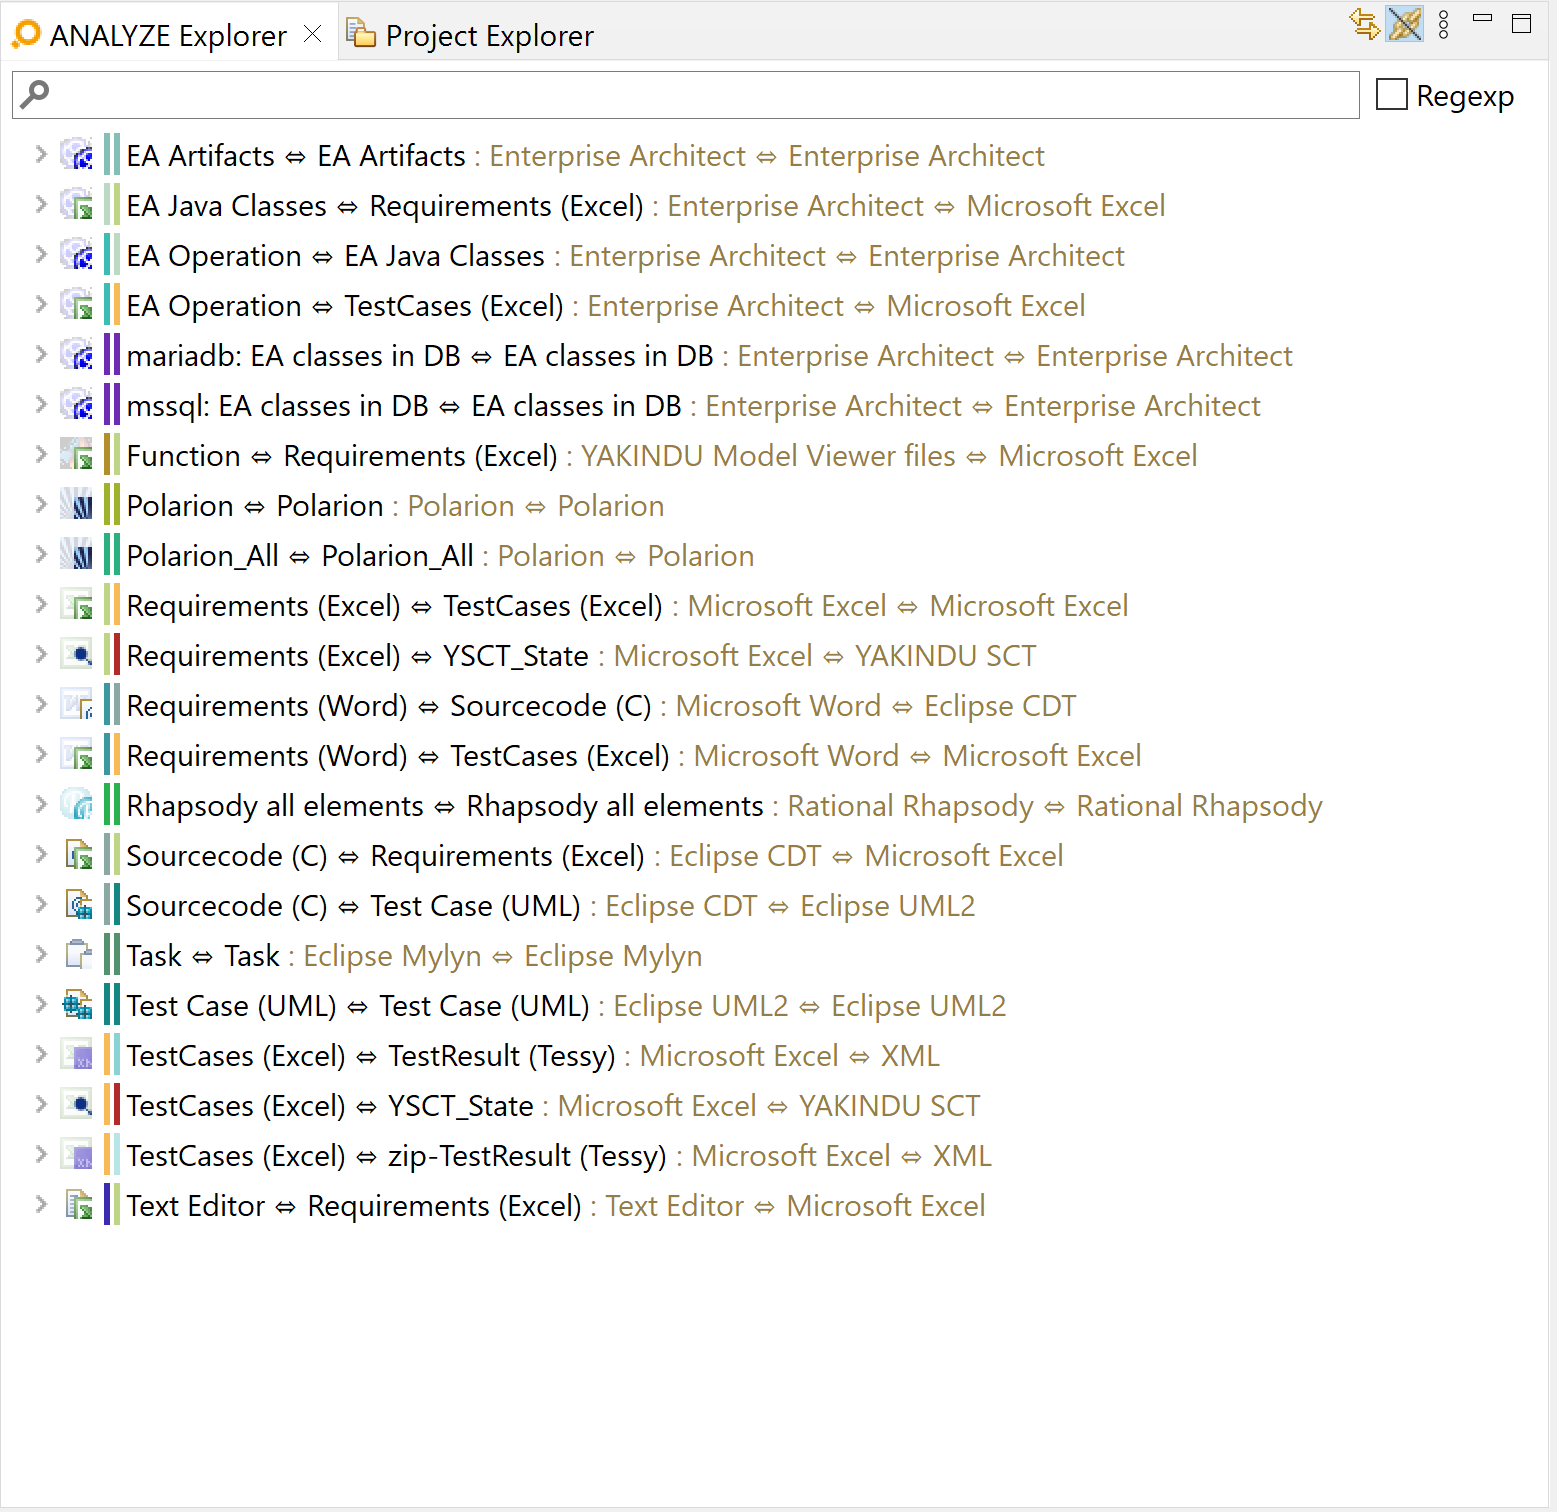
ANALYZE Link Type Issue Decorator
Similar to the ANALYZE Link Relation Decorator, this decoration is visible in the ANALYZE Explorer if the Group By setting is set to Link Type. It is labeled with an issue icon in the top left corner of the link type icon.
ANALYZE Self-Linked Artifact Decorator
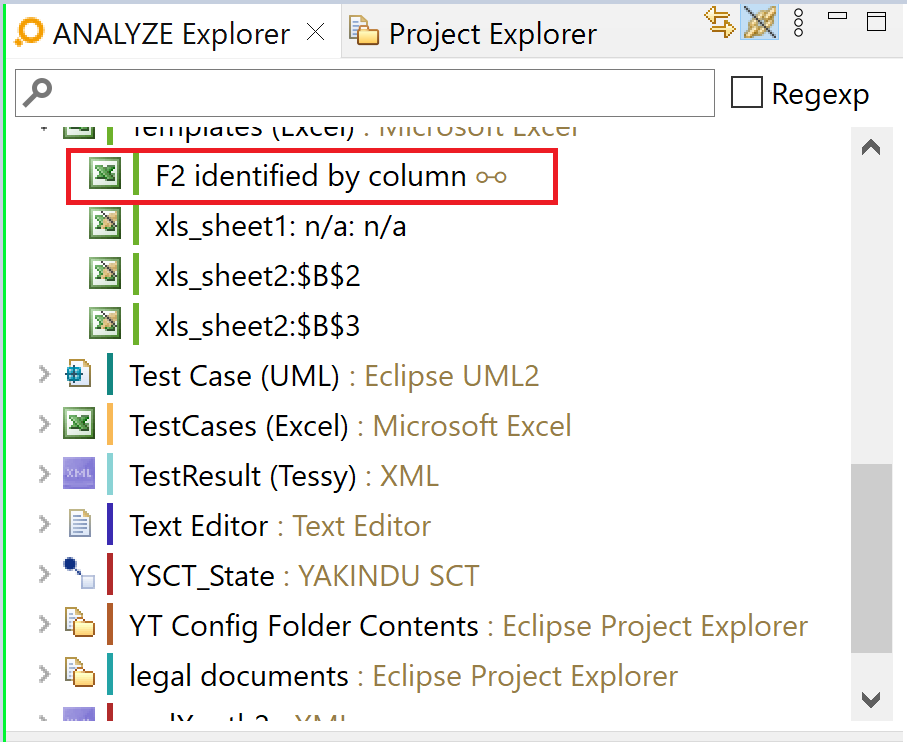
When an artifact is linked with itself, we call it a self-linked artifact. With the ANALYZE Self-Linked Artifact Decorator enabled, you can see which artifacts have this property. When it is enabled, self-linked artifacts will be labeled with a symbol behind the name. This symbol is visible in the ANALYZE Explorer and in the ANALYZE Overview.
ANALYZE Overview
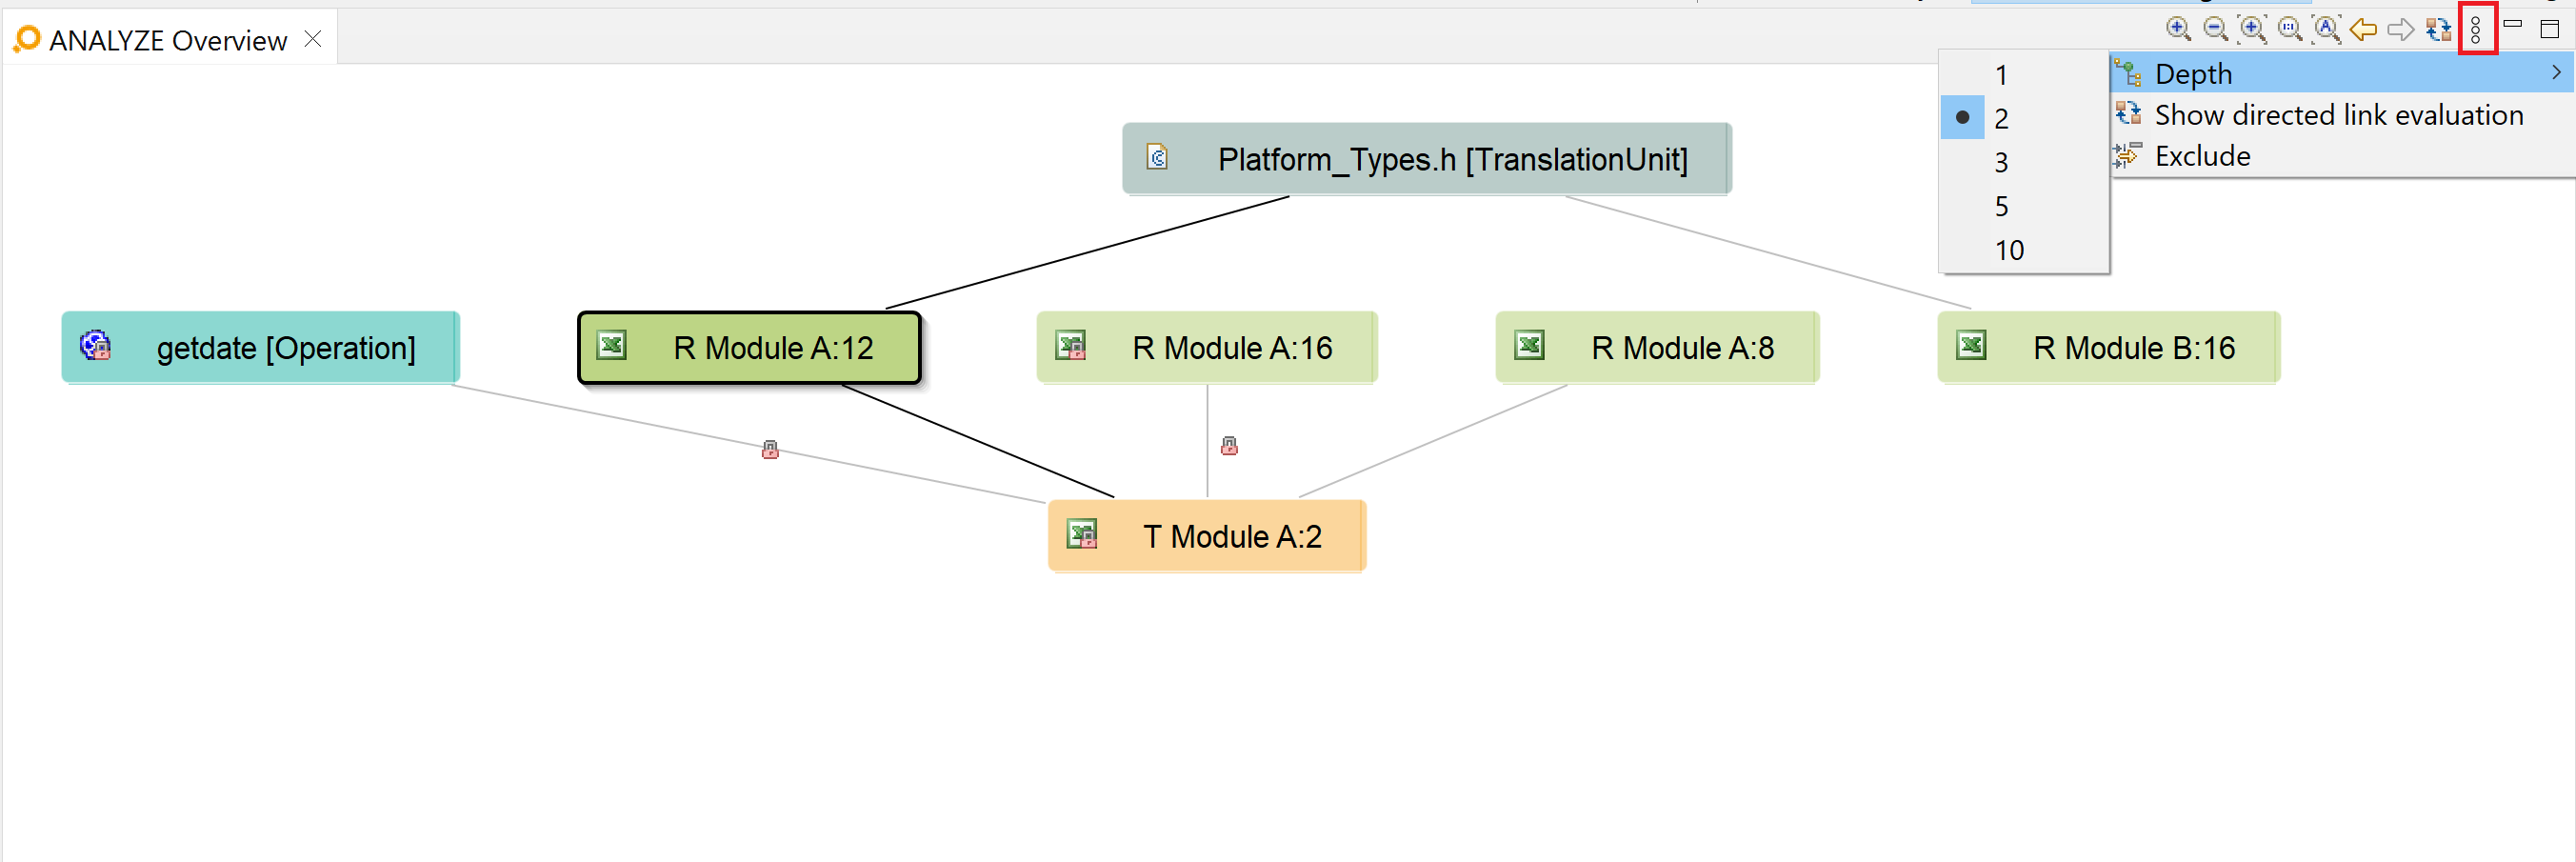
The ANALYZE Overview view displays a live impact analysis graph by showing artifacts that are related to the current context. A double-click on an artifact node in the graph opens the artifact in its corresponding editor.
The zooming can be adjusted by the icons Zoom in, Zoom out, Zoom to fit, Zoom to original size, and Auto Zoom to fit in the toolbar of ANALYZE Overview. You can also zoom by using the mouse wheel. You can scroll in the view either by using the scroll bars or by dragging the graph with the left mouse button pressed in an empty area.
The ANALYZE Overview maintains a selection history that allows you to switch back-and-forth between your previous selections via the arrow icons in the toolbar. Alternatively, you can use the keyboard shortcut Ctrl+Alt+Left to switch to the previous selection and Ctrl+Alt+Right to switch to the next one.
Using the menu, you can invoke a couple of operations:
- Setting the depth of the shown graph.
- Switching the context definition:
- Current selection: ANALYZE Overview calculates a graph consisting of the last selected artifact as "root" and all artifacts linked to this root with a distance that is not longer than the chosen depth.
- All traces: ANALYZE Overview always shows the complete trace graph. Selection and depth are not considered.
- Displaying directed links only (links outgoing from the selection until the specified depth) or displaying all links (incoming as well as outgoing).
- Defining an exclusion filter. This is a blacklist of artifact types. Artifacts of these types won't be shown in ANALYZE Overview.
Learn more about directed versus undirected links in the blog post "About bidirectional traceability, link semantics and a toggle button".
ANALYZE Search
The ANALYZE Search view provides a full text search over all artifacts and their attributes. Search term suggestions are provided as you type. The search results are displayed below the search field. If a search result is clicked, the artifact is selected in the ANALYZE Overview and added to the ANALYZE Selection History.
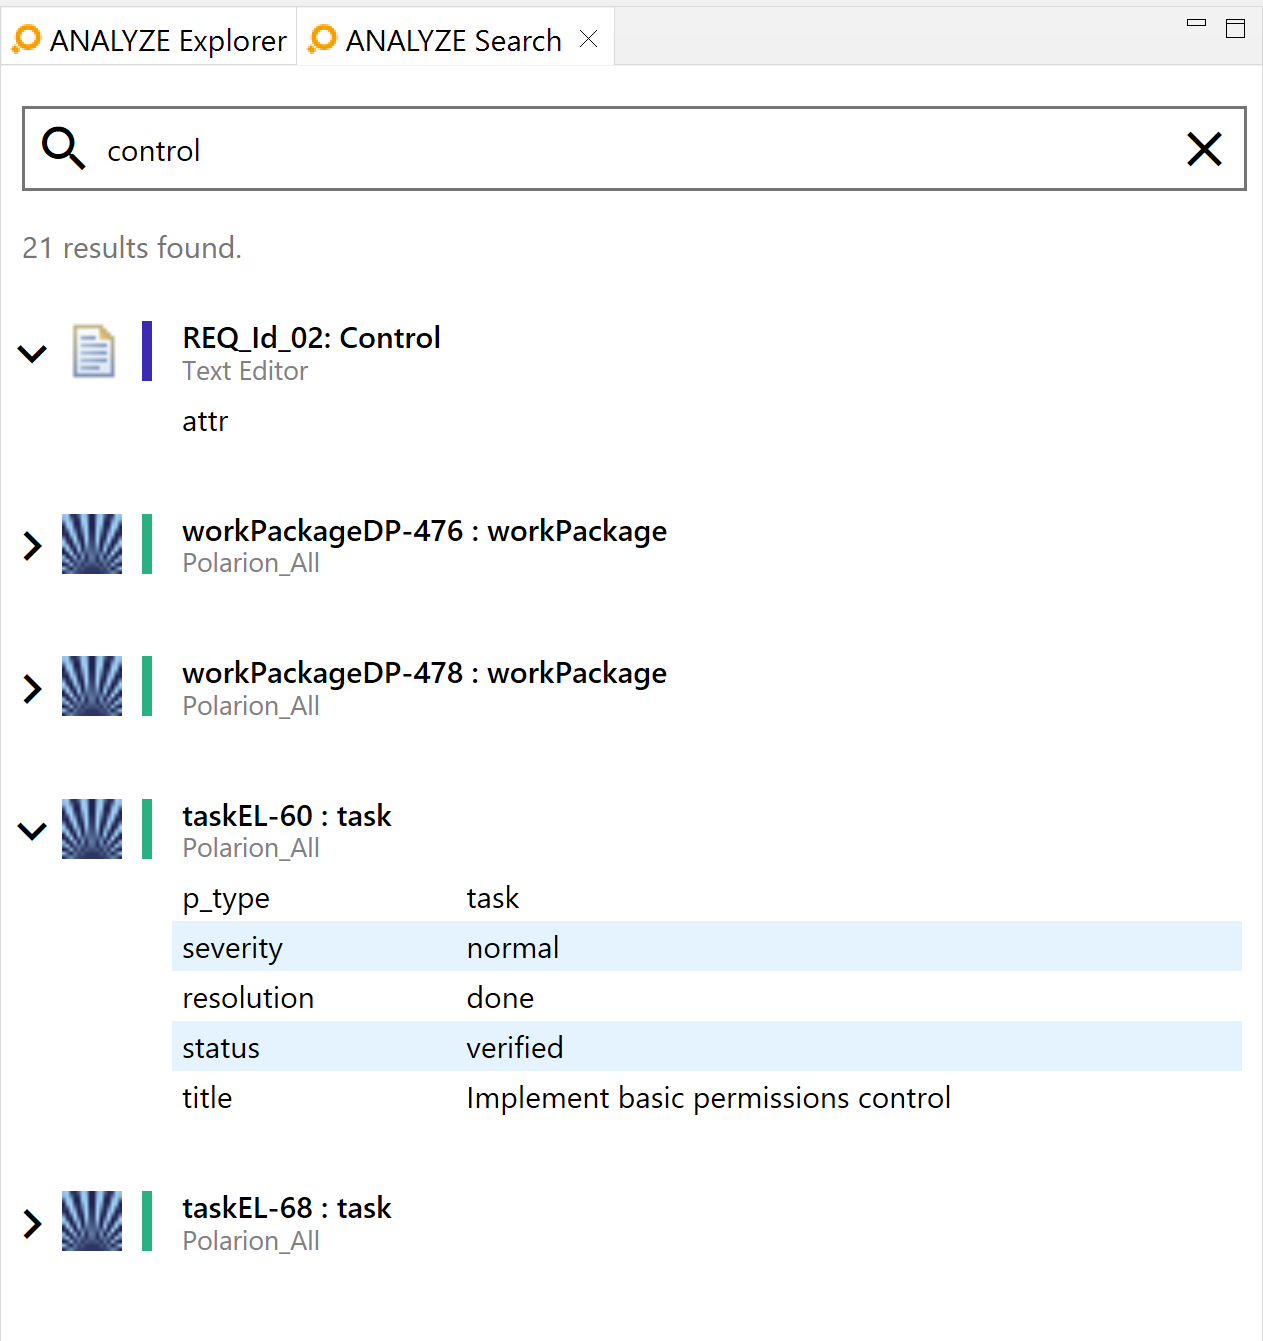
You can enter one or more search terms in the search input field. If you enter more than one term, only artifacts that contain all of these terms in their name, type, or attribute values will be found.
The ANALYZE Search supports the Lucene Query Syntax to perform more complex search queries (like filtering for specific fields, wildcards, etc.).
The following fields can be used to refine your query:
- name - artifact name
- artifactTypeName - artifact type name
- attributes._KEY_ - custom attribute KEY
Examples:
| Search Query | Searches for... |
|---|---|
name:control | artifacts containing the word "control" (or "Control" as the search is case insensitive) in the artifact name |
require* | artifacts containing a word starting with "require" (like "requirement" or "requires") |
attributes.author:Doe | artifacts with a custom attribute "author" that contains the word "Doe" |
front OR rear | artifacts that contain either "front" or "rear" in their name, type, or custom attribute values |