Dashboards
A dashboard shows the results of queries as charts and tables. Each project has one or more dashboards; Dashboards in the project sidebar opens them.
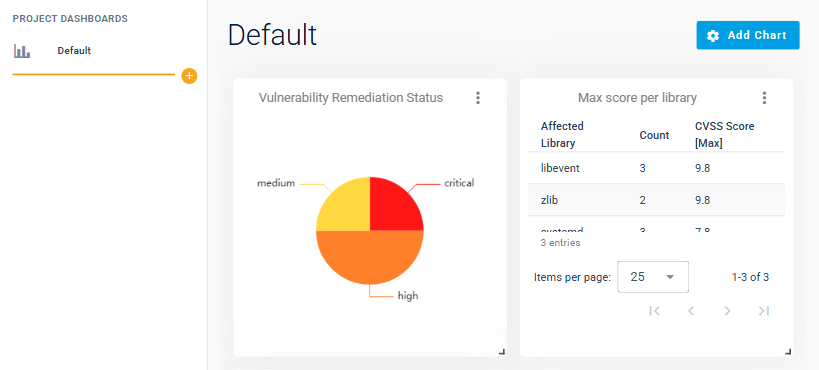
The widgets on a dashboard are built from query results. A query is defined in ANALYZE Desktop; its result, a table of rows and columns, is uploaded together with a snapshot. What queries are and how they are written is described in the ANALYZE Desktop section:
- The "ANALYZE Queries" and "ANALYZE Query Results" views
- The ANALYZE query language
- Query result meta model
A dashboard always shows the snapshot selected in the app bar. If the snapshot has no result for a widget's query, the widget shows "Widget not available in this snapshot". If no query results were uploaded with the snapshot, Add Chart offers no Query Results; ask your administrator.
This chapter shows how to:
- Manage dashboards: add, rename and delete them
- Add widgets to a dashboard
- Configure a widget: what it shows and how
- Drill into a widget down to the artifacts