Add widgets
A widget shows the result of one query. Depending on your role, adding widgets may not be available to you. The queries you can choose from are those whose results were uploaded with the snapshot selected in the app bar; see Dashboards.
Add a widget
-
Open the dashboard and click Add Chart. The menu Available Metrics opens.
-
Open Query Results. It lists one entry per query result of the snapshot, with its name and a short description.

-
Click the query result. The widget appears on the dashboard, with the name of the query as its title.
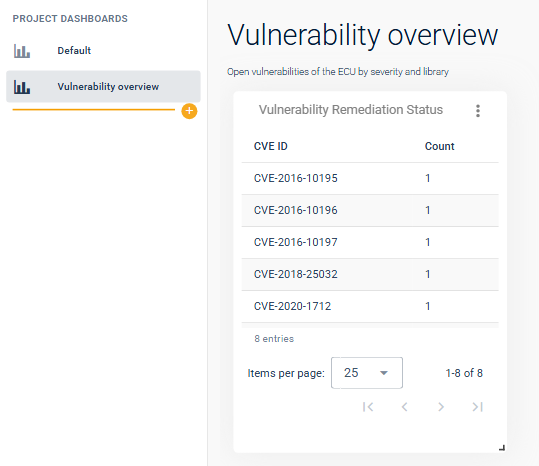
A new widget shows the query result in a default way. To choose what it shows, see Configure a widget. You can add the same query result more than once, for example once as a pie chart and once as a table.
Resize a widget
Drag the corner at the lower right of the widget.
Remove a widget
Click ⋮ in the title bar of the widget and choose Remove. The widget is removed at once, without a confirmation.
