Configure a widget
Usually, a widget shows its query result grouped by one column, with one or more metrics per group, for example the number of vulnerabilities per severity. You choose the column, the metrics and the kind of chart; depending on your role, this may not be available to you.
- Click ⋮ in the title bar of the widget and choose Configure. The configuration dialog opens, with a Preview of the widget on the right.
- Change the settings described below. The preview follows each change.
- Click Apply to keep the changes, or Cancel to leave the widget as it was.
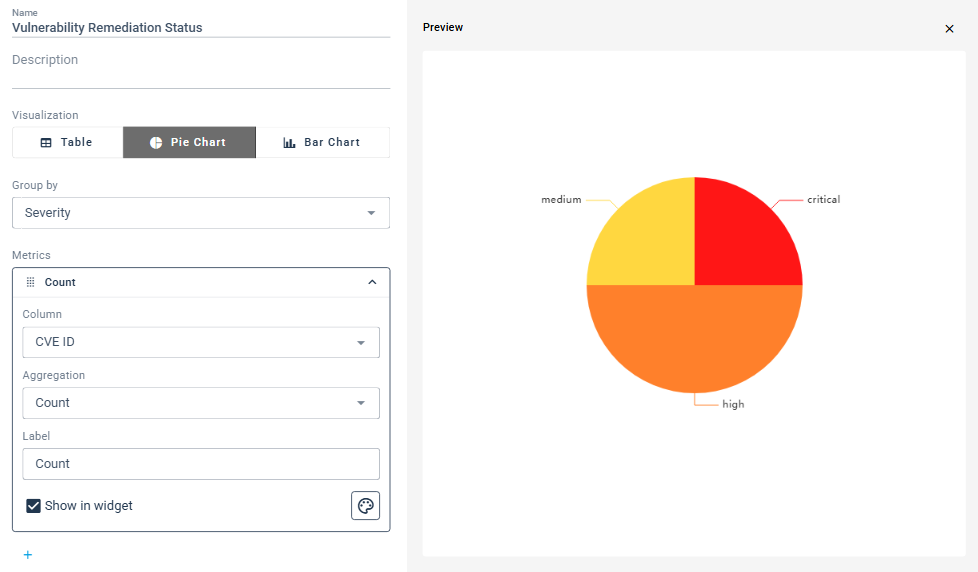
Name and description
Name is the title shown at the top of the widget. Description is optional.
Visualization
Table, Pie Chart or Bar Chart. A table shows one row per group with one column per metric.
Group by
Group by lists the columns of the query result. The widget shows one group, for example one pie segment or one table row, for each value found in that column. If you clear Group by, the dialog shows no Metrics.
Metrics
Each metric is computed per group. Click a metric to open its settings:
- Column: the column of the query result the metric is computed from.
- Aggregation: how the values of that column are combined in a group: Count not empty, Count, Count distinct, Count distinct not empty, Sum, Average, Min or Max.
- Label: the name the metric is shown with.
- Show in widget: clear it to keep the metric out of the widget.
- The button with the palette sets a color for the metric.
+ below the metrics adds another one. Once a widget has more than one metric, ⋮ next to each metric offers Duplicate and Remove.
Groups
Below the metrics, the dialog lists the groups found in the query result.
- Clear the check box in front of a group to hide it in the widget. Select all shows or hides all of them, and Filter groups narrows the list to the groups whose name contains what you type.
- Type in a group's field to show it under another label.
- The color button at the end of a row sets the group's color.
- For pie and bar charts, Labels Display switches the labels next to the segments on or off.