Drill into a widget
Behind every segment of a chart are rows of the query result. To see them, click the segment. A list opens over the dashboard, titled with the query and the group, for example "Vulnerability Remediation Status: critical".
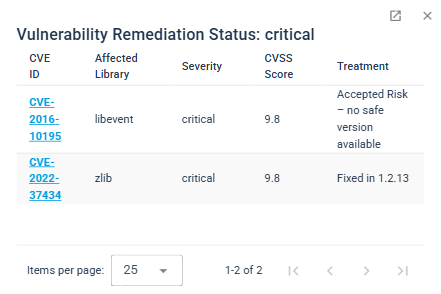
The list shows the rows of the query result that belong to the group, with all of its columns.
- A value shown as a link stands for an artifact. Click it to open the Data Explorer with that artifact selected.
- Open in new tab, the icon at the top right next to ×, opens the list on a page of its own in a new browser tab.
- × closes the list.