Data Explorer
Data Explorer in the project sidebar shows the snapshot named in the app bar as a diagram. In it you find artifacts, see their attributes, and follow the links between them, for example from a requirement down to the tests that verify it.
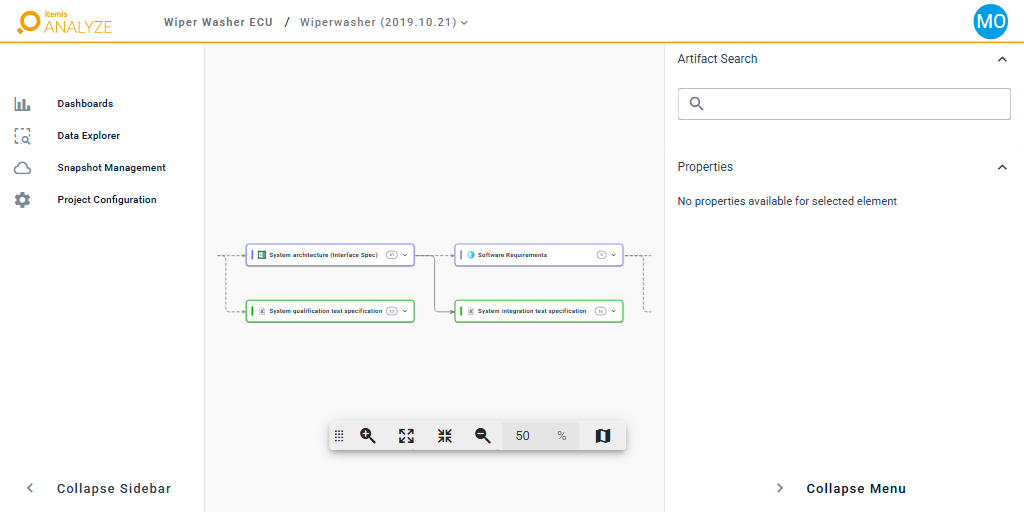
- Each box in the diagram is a container for one artifact type. Its header shows the name of the artifact type and how many artifacts of this type the snapshot has.
- Each arrow between two containers stands for a link type: artifacts of these two types can be linked. A dashed arrow leads to or from a container whose artifact type has no artifacts in this snapshot.
- On the right, Artifact Search finds artifacts in the whole snapshot, and Properties shows the attributes of what you selected. Collapse Menu at the bottom hides the panels and gives the diagram more room; the arrow that remains shows them again.
Artifacts, artifact types, links and link types are the concepts of itemis ANALYZE. They are explained in the ANALYZE Desktop section: Artifacts and artifact types and Links and link types. The Data Explorer shows them as they are in the snapshot; you cannot change artifacts or links in it.
The examples in this chapter use the project Wiper Washer ECU: the traceability data of a wiper and washer control unit, developed along the Automotive SPICE V-model from requirements over architecture and design to code and tests.
This chapter shows how to:
- Navigate the overview: zoom, move around, open containers, and read the link dots of an artifact
- Find artifacts by name or attribute value
- Follow links between artifacts
- See the properties of an artifact or an artifact type