DISCLAIMER: This example only work with UNIX based systems due to the nature of Eclipse console
Debug and remote control state machines using YET
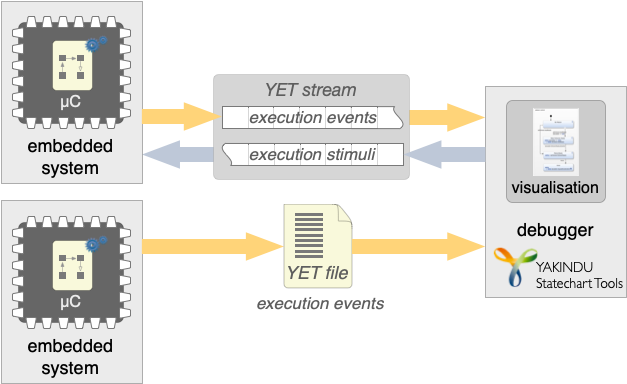
The CREATE Execution Trace (YET) infrastructure supports interoperability between state machines running in a target application and the CREATE tooling. It supports model-level debugging and testing of the state machines based on execution traces. This example shows how to remote debug a compiled state machine step by step. Please refer to the YET documentation for more information.
The Tic-Toc example application
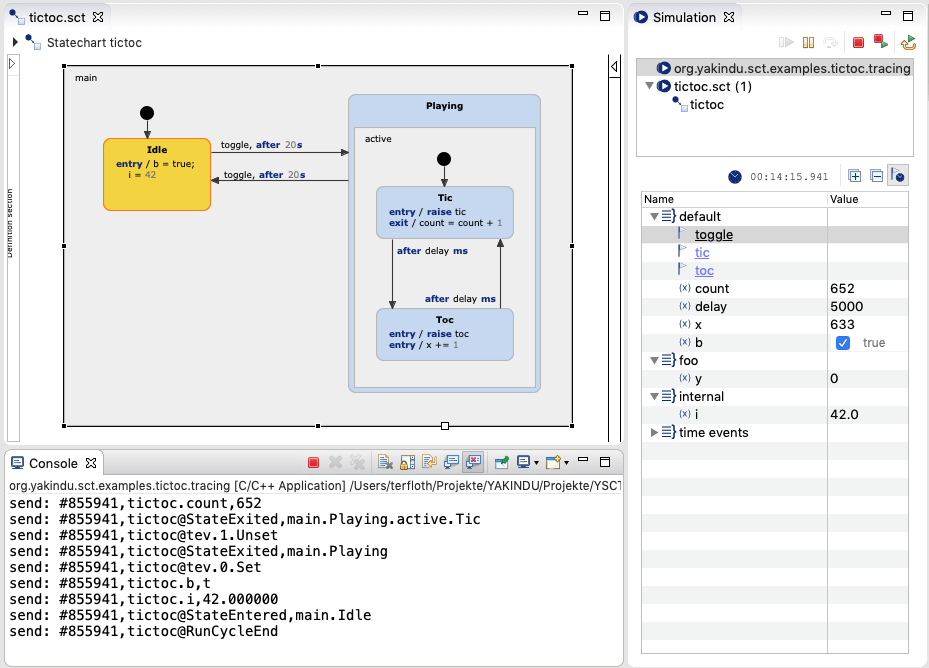
The example state machine is simple and has no specific semantics. It simply highlights how to use YET. The state machine is has two states Idle and Playing. The single input event toggle switches between these two states. Within Playing state the state machine automatically switches between the states Tic and Toc and raises out events tic and toc respectively when entering these states. The time interval between these state changes is defined by the variable delay.
This state machine is executed within an interactive application. This application can be used from the command line. It reads user input from the standard input and writes to the standard output. It is built to run on the host machine. If you have to integrate YET into your application then you can use the example code as a template.
Building the application
The example project is a Eclipse CDT project. Configure your platform specific compiler tool chain in the project properties. Please note that you have to generate the state machine and tracing code. With automated build switched on this happens automatically, otherwise you have to generate code from the two sgen files manually by selecting Generate Code Artifacts from the files' context menus.
Running the application
When everything is built properly then you can simply run the executable from Eclipse (on project entry select Run As > Local C/C++ Application) or from the terminal. You will see this output.
Sending to 127.0.0.1:4444
Welcome to Tictoc! Press:
't' to toggle tictoc idle state
'+' to increase tictoc delay
'-' to decrease tictoc delay
'l' to enable or disable log
'u' to disable or enable udp tracing
'h' for this help
... followed by ENTER.


send: %tictoc@Enter,1
send: #2,tictoc@tev.0.Set
send: #2,tictoc.b,t
send: #2,tictoc.i,42.000000
send: #2,tictoc@StateEntered,main.Idle
The first block includes just some output from the application during start up. This includes instructions how to interact with the application from the command line. The second block is the log output of trace events which are emitted by the state machine. Simply play around with the different input options.
In addition to what you see on the console the application sends the trace events to the configured socket using UDP and also writes these to the file trace.yet
Debugging the statemachine trace
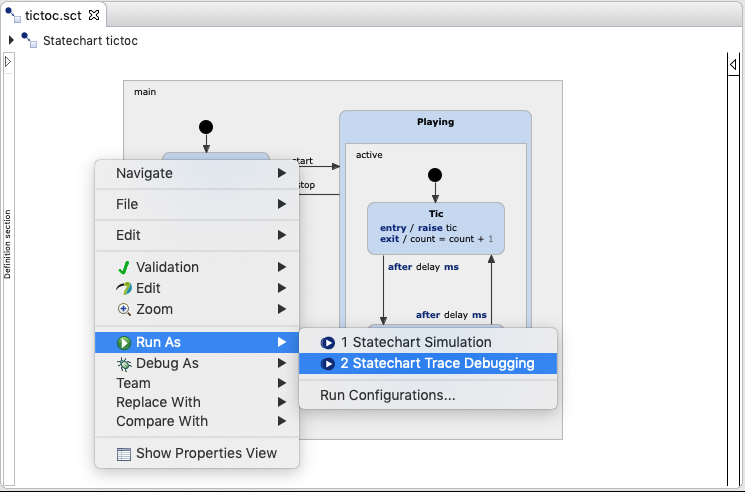
Debugging a statechart YET trace is simple. Within a statechart editor or on the model file entry in the project explorer choose Run As > Statechart Trace Debugging from the context menu.
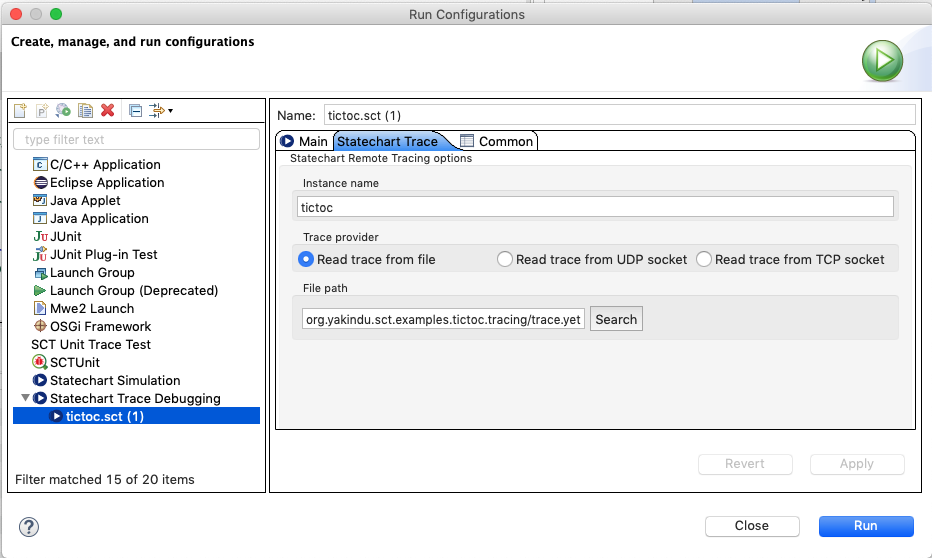
This will launch the trace debugger and by default will try to read the execution trace from the file trace.yet from the root of the project folder. If it is not already in place then create this trace file e.g. by starting the application with enabled YET file tracing. The UI of the trace debugger is identical to the regular simulation UI. If you want to choose a different trace file you have to reconfigure the run configuration which was created by the Run As > Statechart Trace Debugging action. To do this choose Run As > Run Configurations… from the context menu. The Run Configurations dialog pops up and choose the proper entry in the category Trace Debugging. The tab Statechart Trace provides several configuration options. First, the instance name is used to distinguish between multiple running instances of the same state machine if multiple state machines are executed on the target and if they share a common trace channel. The default is just the name of the statechart model. The obviously most important option is how you want to read or receive traces. It is possible to choose one of three trace providers:
- Read trace from file - supports to configure what file should be used.
- Read trace from UDP socket - opens a UDP socket on the local machine with a configurable port (default 444). The physical trace channel on the embedded target can connect to this port to setup a bidirectional communication channel.
- Read trace from TCP socket - uses TCP instead of UDP to setup a bidirectional communication channel and can be configured in the same way.The default port is 8444.
After that, click Apply and Run. The trace debugger UI will be activated. If UDP or TCP trace provider are used then no active statechart state may be highlighted in the Debugger UI. This is always the case if no remote target is connected or if the statechart is not yet activated on the remote target.
Integrating YET into your application
As stated before some manual implementation steps are required to enable your application for YET tracing. Please feel free to reuse the implementation of this example and take a closer look at the YET documentation