ANALYZE Overview Copy link to clipboard
The
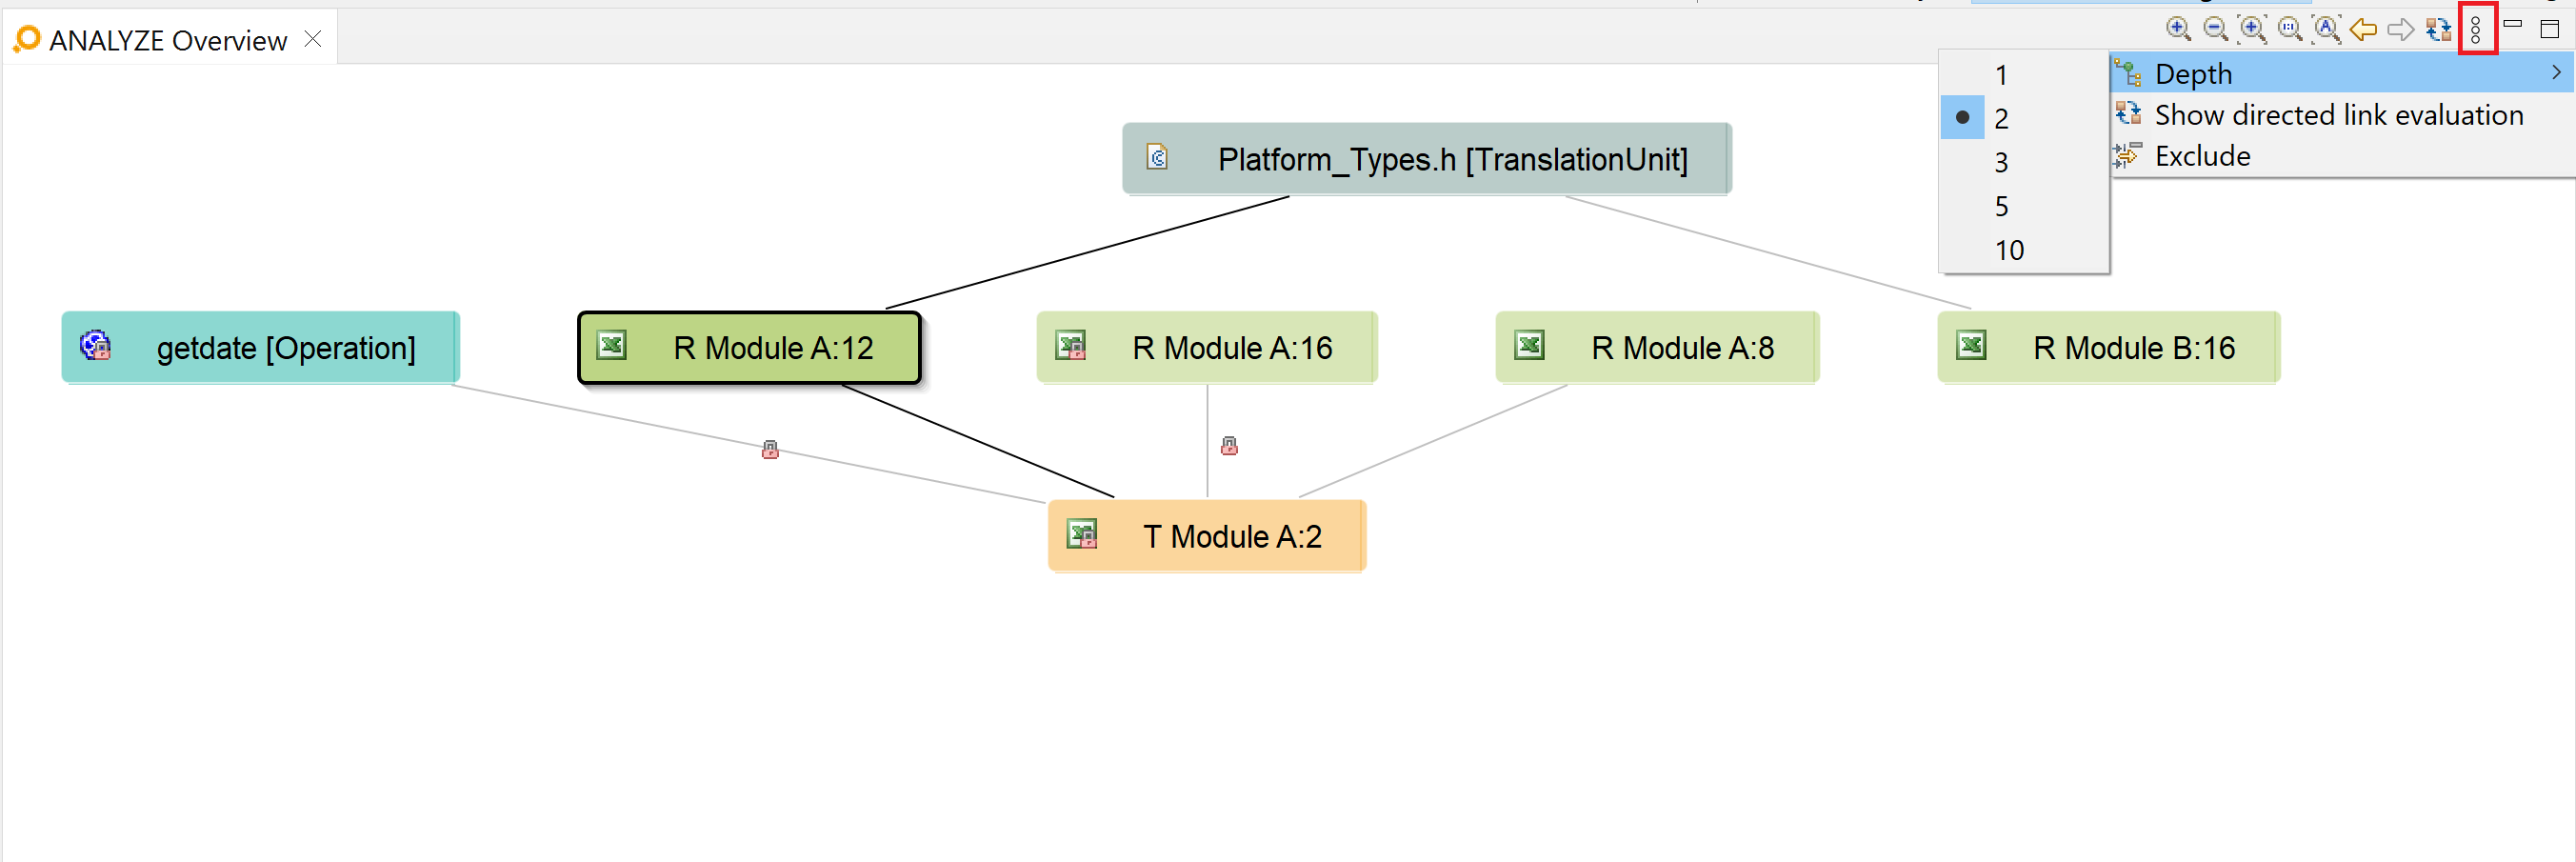
ANALYZE Overview view displays a live impact analysis graph by showing artifacts that are related to the current context. A double-click on an artifact node in the graph opens the artifact in its corresponding editor.
The zooming can be adjusted by the icons
Zoom in,
Zoom out,
Zoom to fit,
Zoom to original size, and
Auto Zoom to fit in the toolbar of
ANALYZE Overview. You can also zoom by using the mouse wheel. You can scroll in the view either by using the scroll bars or by dragging the graph with the left mouse button pressed in an empty area.
The ANALYZE Overview maintains a selection history that allows you to switch back-and-forth between your previous selections via the arrow icons in the toolbar. Alternatively, you can use the keyboard shortcut Ctrl+Alt+Left to switch to the previous selection and Ctrl+Alt+Right to switch to the next one.
Using the menu, you can invoke a couple of operations:
- Setting the depth of the shown graph.
- Switching the context definition:
- Current selection: ANALYZE Overview calculates a graph consisting of the last selected artifact as „root” and all artifacts linked to this root with a distance that is not longer than the chosen depth.
- All traces: ANALYZE Overview always shows the complete trace graph. Selection and depth are not considered.
- Displaying directed links only (links outgoing from the selection until the specified depth) or displaying all links (incoming as well as outgoing).
- Defining an exclusion filter. This is a blacklist of artifact types. Artifacts of these types won’t be shown in ANALYZE Overview.
Learn more about directed versus undirected links in the blog post "About bidirectional traceability, link semantics and a toggle button".